How to Print Summary of the Table, Timetable, or Categorical Array in MATLAB
A summary() is a built-in MATLAB function used for displaying the summary of each variable in the table or timetable. This function also prints the summary of each category lying in the categorical array. The summary of the table or timetable includes the min, max, and median values of each variable of the specified table or timetable. When applied to a categorical array, the summary() function displays the occurrence count for each category within the array. This function is useful for quickly obtaining an overview of the data and understanding its characteristics.
In this article, we will learn how to print the summary of the table, timetable, or categorical array in MATLAB.
Article Arrangement
This guide will consist of:
-
- How to Use summary() Function in MATLAB?
- How to Print the Summary of the Table in MATLAB?
- How to Print the Summary of the Table as a Structure in MATLAB?
- How to Print the Summary of the Timetable in MATLAB?
- How to Print the Summary of the Timetable as a Structure in MATLAB?
- How to Print the Summary of the Categorical Array in MATLAB?
- How to Print the Summary of the Categorical Array Along Dimension in MATLAB?
1: How to Use summary() Function in MATLAB?
The summary() is a built-in MATLAB function that allows us to print the summary of the given table, timetable, or, categorical array. This function takes the table, timetable, or categorical array as input and returns their summary as output. This function follows a simple syntax that is given below:
s = summary(T)
summary(A)
summary(A,dim)
Here:
summary(T) yields to print the summary of a timetable or a table.
-
- If T represents a table, then summary(T) prints the description of the table variables using T.Properties.Description.
- If T represents a timetable, then summary(T) prints the description of the row times and the timetable variables using T.Properties.Description.
s = summary(T) returns a structure s with a summary of the provided table or timetable. Each field in s is a structure on its own that represents a summary of the data in the associated variable in T. The structure additionally has a field that lists the row timings of T if T is a timetable.
summary(A) displays the categorical array summary.
-
- The summary(A) outputs the category names and the total number of items in each category (the category counts) if A represents a vector. Additionally, it shows how many components are undefined.
- If A is a matrix, the summary() function considers its columns as vectors and outputs category counts for each of A’s columns.
- If A represents a multidirectional array, the summary() function only applies to the first dimension whose size is not equal to 1.
summary(A,dim) displays the overall number of components in each category (the category counts) along the dim dimension.
2: How to Print the Summary of the Table in MATLAB?
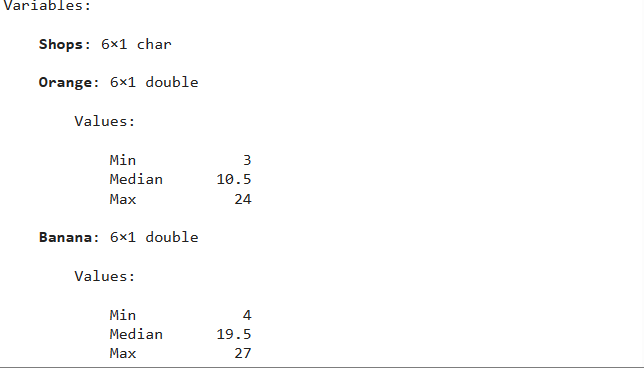
We use the summary() function that prints the summary of each variable of the given table in MATLAB. For example:
Banana = [27;8;4;19;20;22];
Watermelon = [19;36;74;27;19; 7];
Strawberry = [6; 36; 18; 30; 29; 32];
Shops = [ 'A'; 'B'; 'C'; 'D'; 'E'; 'F'];
T = table(Shops, Orange, Banana, Watermelon, Strawberry);
summary(T)
In the above example, first, we create a table having data of the six fruit shops. Then we use the summary() function that prints the summary of the variables of the specified table. This summary includes each variable’s minimum, median, and maximum values.

2.1: How to Print the Table Summary as a Structure in MATLAB?
We use the summary() function by specifying the output argument to print the summary of the given table as a structure in MATLAB. For example:
Banana = [27;8;4;19;20;22];
Watermelon = [19;36;74;27;19; 7];
Strawbery = [6; 36; 18; 30; 29; 32];
Shops = [ 'A'; 'B'; 'C'; 'D'; 'E'; 'F'];
T = table(Shops, Orange, Banana, Watermelon, Strawberry);
s = summary(T)
The given example is the previously discussed example but now it implements the summary function by specifying the output arguments and prints the summary of the given table as a structure.

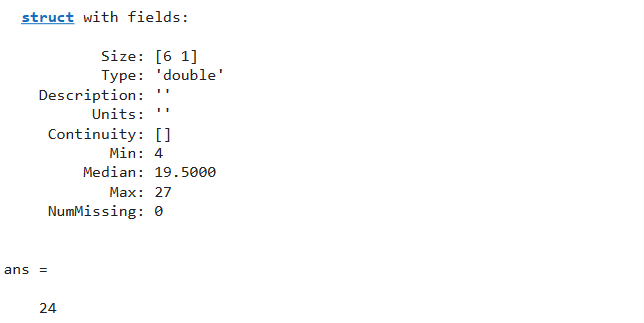
Now we can use the output argument s to display any variable information in the specified table T using the dot operator. For example:
Banana = [27;8;4;19;20;22];
Watermelon = [19;36;74;27;19;7];
Strawberry = [6; 36; 18; 30; 29; 32];
Shops = [ 'A'; 'B'; 'C'; 'D'; 'E'; 'F'];
T = table(Shops, Orange, Banana, Watermelon, Strawberry);
s= summary(T);
s.Banana
s.Orange.Max
In the given example, we use the structure s to display the summary of the variable Banana and to print the maximum value of the variable Orange specified in the given table T.
3: How to Print the Summary of the Timetable in MATLAB?
The summary() function can also be used to print the summary of the given timetable in MATLAB. For example:
time_table = timetable(Time,{'CF';'NS';'NSM';'ISSM';'MA';'DF';'CSICS';'MSS'},...
'VariableNames',{'Subjects_Name'});
summary(time_table)
In the above example, first, we create a timetable for a class. Then we use the summary() function that prints the summary of the row times and the variables of the specified timetable. This summary includes each variable’s minimum, median, and maximum values.

3.1: How to Print the Timetable Summary as a Structure in MATLAB?
We use the summary() function by specifying the output argument to print the summary of the given timetable as a structure in MATLAB. For example:
time_table = timetable(Time,{'CF';'NS';'NSM';'ISSM';'MA';'DF';'CSICS';'MSS'},...
'VariableNames',{'Subjects_Name'});
s=summary(time_table)
s.Time
In the given example, we use the structure s to display the summary of the variable Time specified in the given timetable T.

4: How to Print the Summary of the Categorical Array in MATLAB?
We can also use the summary() function to print the summary of the given categorical array in MATLAB. For example:
summary(A)
In the above example, first, we create a categorical having 4 categories A, B, C, and, D. Then we use the summary() function that prints how many occurrences of each category there are.

4.1: How to Print the Summary of the Categorical Array Along Dimension in MATLAB?
The MATLAB summary() function can print the summary of the given categorical array along the dimension. For example:
summary(A,2)
In the above example, first, we create a categorical array having 4 categories A, B, C, and, D. Then we use the summary() function along dimension 2 that prints the index of occurrences of each category in the matrix form.

Conclusion
The MATLAB summary() function displays the summary of the given table, timetable, or categorical array according to their properties. This function takes an argument that could be a table, timetable, or, categorical array and returns the summary of the specified argument. This tutorial explained different ways of using the MATLAB summary() function with simple examples.
Source: linuxhint.com