How to install Prometheus on Raspberry Pi
This article provides a detailed guideline to install Prometheus on Raspberry Pi.
Install Prometheus on Raspberry Pi
The installation of Prometheus on Raspberry Pi is super easy as it doesn’t require any additional dependencies to operate on your device. The following steps are provided to help you in installing Prometheus on your device.
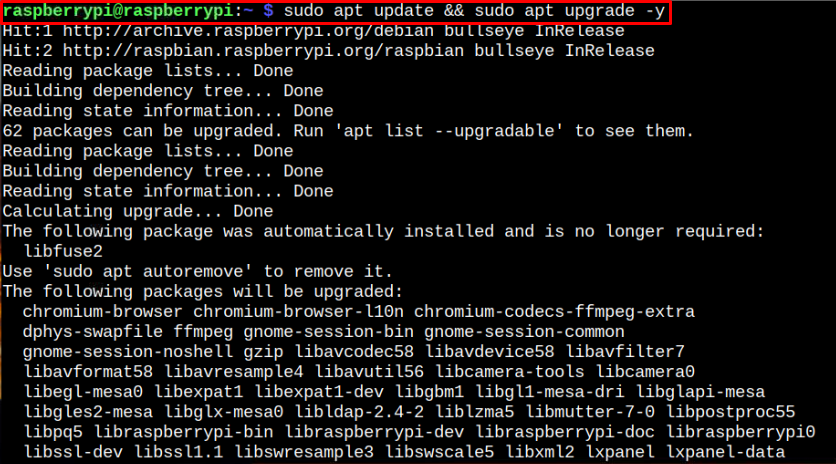
Step 1: Update Packages
First, you are advised to update packages on your Raspberry Pi device through the following command:
Step 2: Download and Install Prometheus on Raspberry Pi
Next, install Prometheus armv7 package on Raspberry Pi from GitHub website through the following command:

If you are using 64-Bit Raspberry Pi OS on your device, then choose arm64 version.
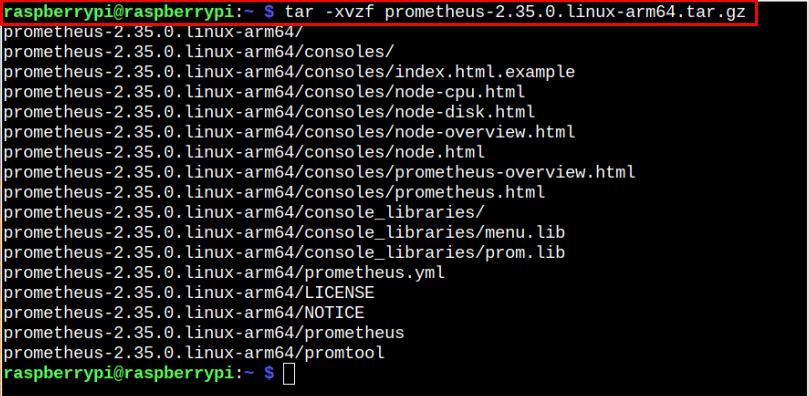
Once the tar.gz file is downloaded, extract the file’s contents using the following command:
Step 3: Change Prometheus Directory Name
The above step will create a directory with the name “prometheus-2.35.0.linux-arm64” which you need to change as this will ease you later on. To change the name, apply the following command:

Step 4: Remove the Prometheus file
Now, remove the previous tar.gz file from your system using the following command:

Step 5: Create a Service File
After the Prometheus installation, you will be required to create a service file within the location “/etc/systemd/system/”. To do this, use the following command to open the service file:
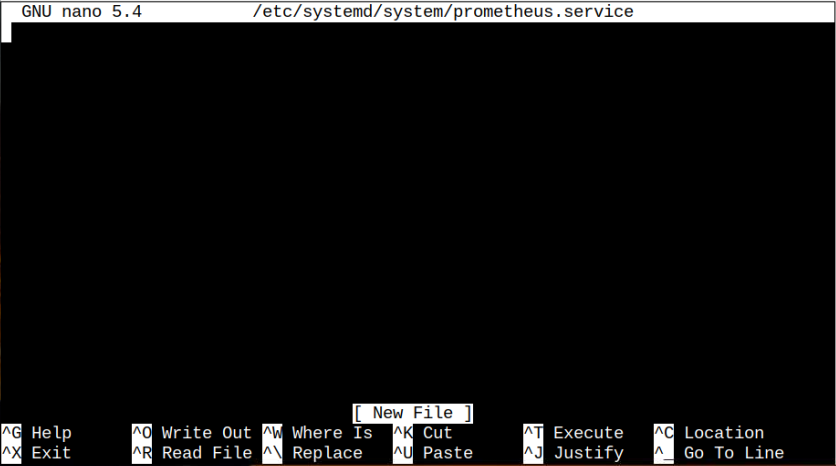
Then adds the following script in the file:
Description=Prometheus Server
Documentation=https://prometheus.io/docs/introduction/overview/
After=network-online.target
[Service]
User=raspberrypi
Restart=on-failure
ExecStart=/home/raspberrypi/prometheus/prometheus \
--config.file=/home/raspberrypi/prometheus/prometheus.yml \
--storage.tsdb.path=/home/raspberrypi/prometheus/data
[Install]
WantedBy=multi-user.target

In the above script, you have to choose your default Raspberry Pi username in the “user” option and set the location accordingly.
Save the file using “CTRL+X” keys, press Y and then use enter to move back to the terminal.
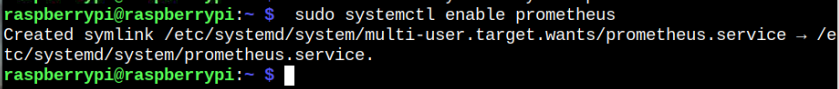
Step 6: Enable Prometheus Service
After completing the above steps, enable Prometheus service on your Raspberry Pi through the following command:
Step 7: Start Prometheus Service
After enabling the Prometheus service, apply the below-given command to start its service on Raspberry Pi device:

You can check the status through following command:
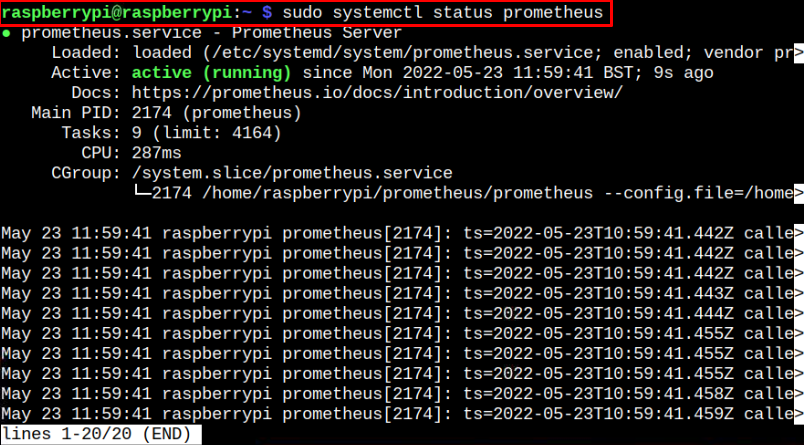
The above output confirms that Prometheus service is running fine on Raspberry Pi 64-Bit OS.
Note : If you are using a 32-Bit Raspberry Pi OS, you may encounter some issues while setting up the Prometheus.
Step 8: Running Prometheus on Raspberry Pi
Now that Prometheus service is running fine on Raspberry Pi, you are good to access its dashboard on your browser tab. However, before that, you will need to find the Raspberry Pi host address through following command:
Then use the address http://192.168.18.218:9090 in your browser to open the Prometheus web interface.
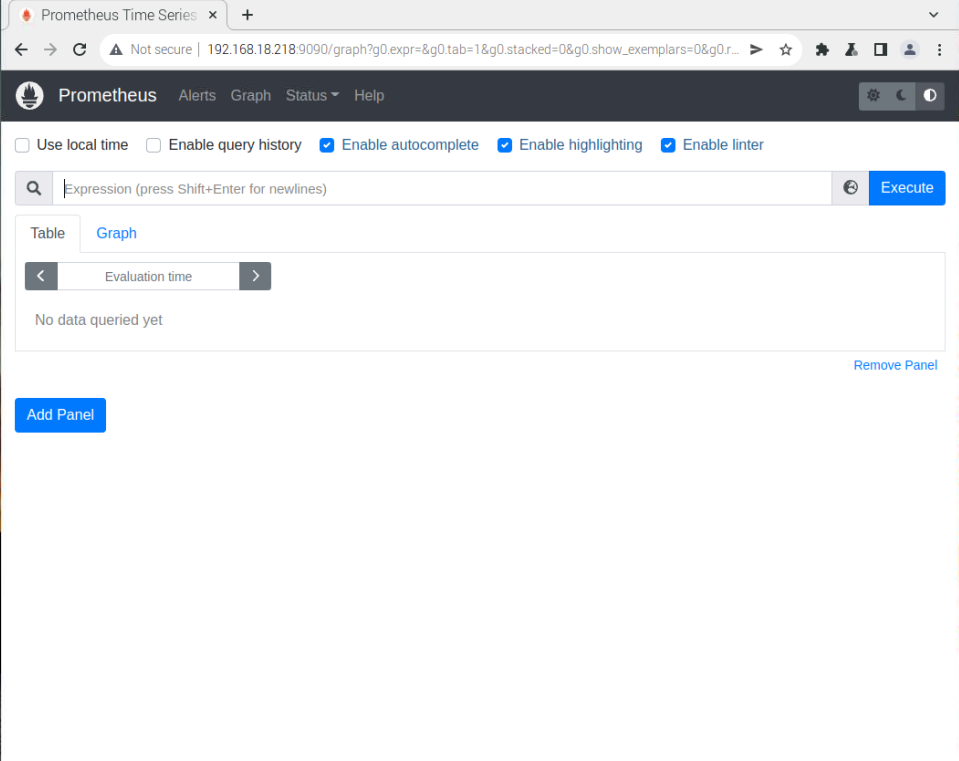
The appearance of Prometheus Dashboard on your browser confirms that the service is running perfectly fine on your Raspberry Pi device.
Conclusion
Prometheus is a great platform to monitor your system’s real-time metrics in a time-series database. It has several built-in tools that enables you to monitor your system performance as well as record metrics that slow down your web applications. The Prometheus installation on Raspberry Pi can easily be completed by downloading the tar.gz file and extracting the contents in your home directory. When the installation finishes, you will access the Prometheus dashboard on your browser tab through the IP address of your Raspberry Pi device.
Source: linuxhint.com