How to Install Grafana – Visualization Tool on Raspberry Pi
This article provides a detailed guideline to install Grafana on Raspberry Pi.
Install Grafana on Raspberry Pi
The installation of Grafana on Raspberry Pi is super easy as it doesn’t require any additional dependencies to operate on your device. Follow the below-given steps to install Grafana on your device.
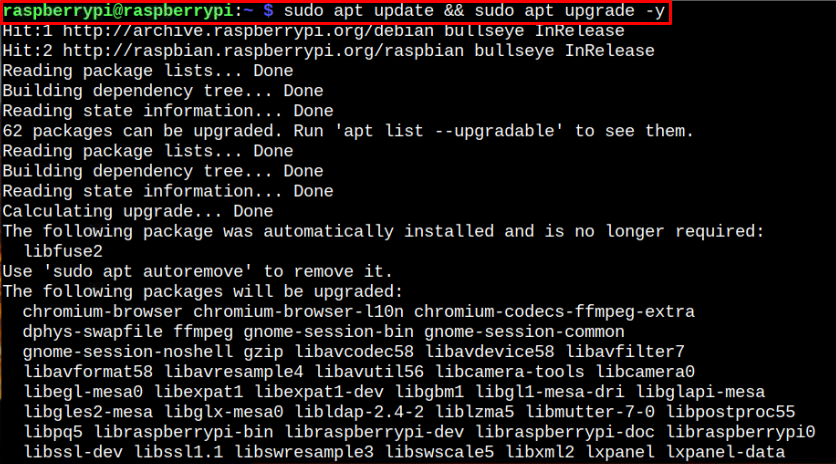
Step 1: Update Packages
First, you are advised to update packages on your Raspberry Pi device through the following command:
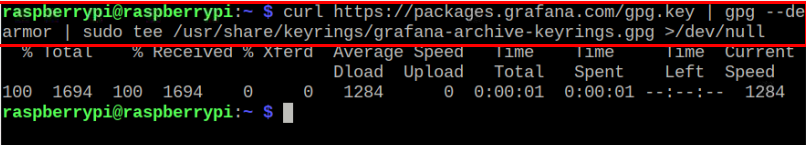
Step 2: Adding GPG Key on Raspberry Pi
Next, add the GPG key through below-mentioned command:
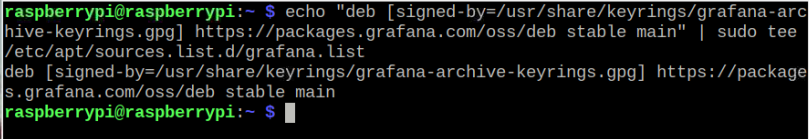
Step 3: Adding Grafana Repository
After adding the key, use the following command to add Grafana repository to the Raspberry Pi list.
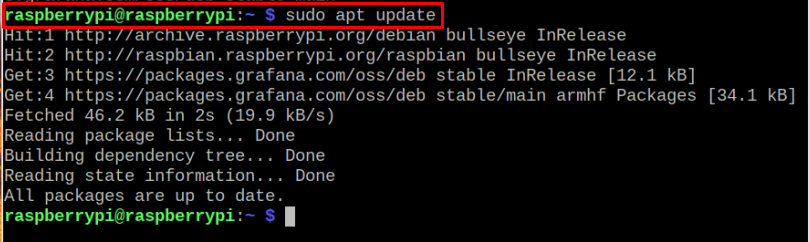
Step 4: Update Repository
After adding the Grafana repository, execute the below-given command to update Raspberry Pi packages list.
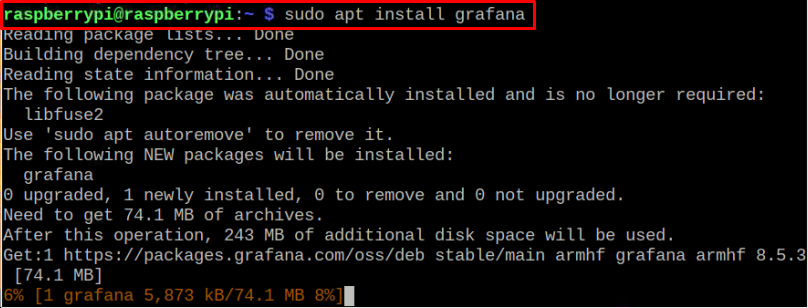
Step 5: Installing Grafana on Raspberry Pi
Once the repository is added, you are now set to install Grafana on Raspberry Pi through following command:
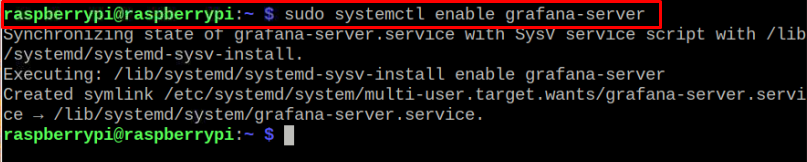
Step 6: Enable Grafana Service
After completing the above steps, enable Grafana service on your Raspberry Pi through the following command:
Step 7: Start Grafana Service
Then use the following command to start Grafana service on your Raspberry Pi device:

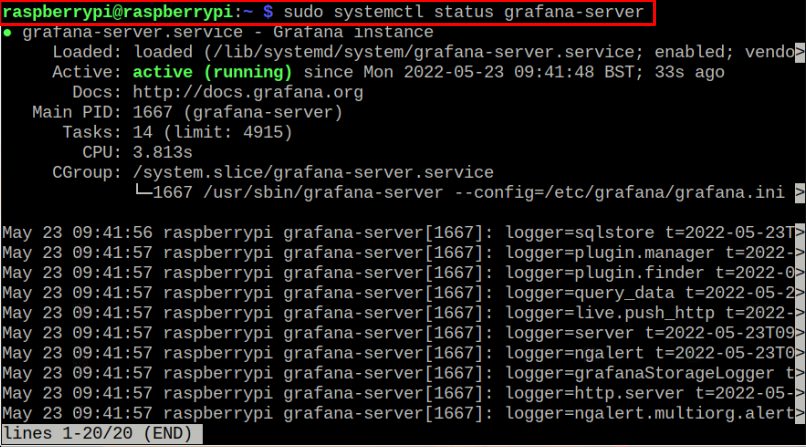
You can check the status through following command:
Step 8: Running Grafana
Now that Grafana service is running fine on Raspberry Pi, you are good to access its dashboard on your browser tab. However, before that, you will need to find the Raspberry Pi host address through following command:
Then use the address https://192.168.18.218:3000 in your browser to open the Grafana GUI interface.
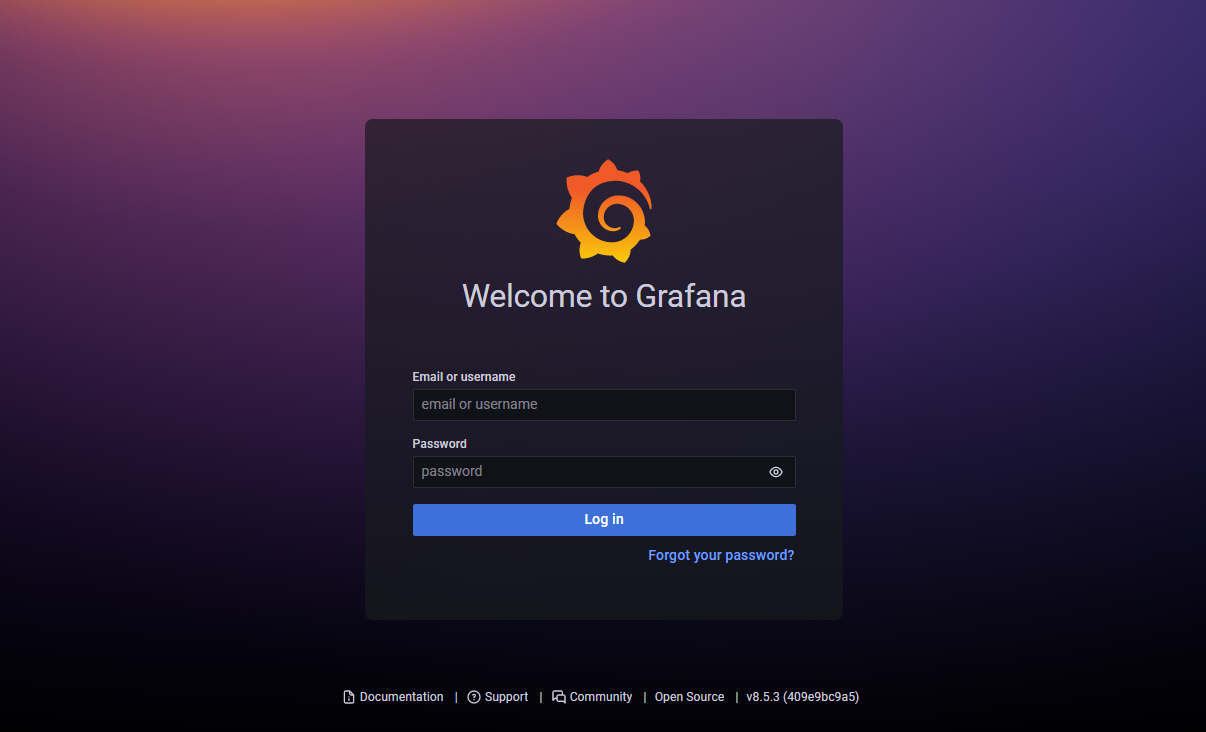
Type “admin” as your default email/username and password. Then choose the“Log in” option.
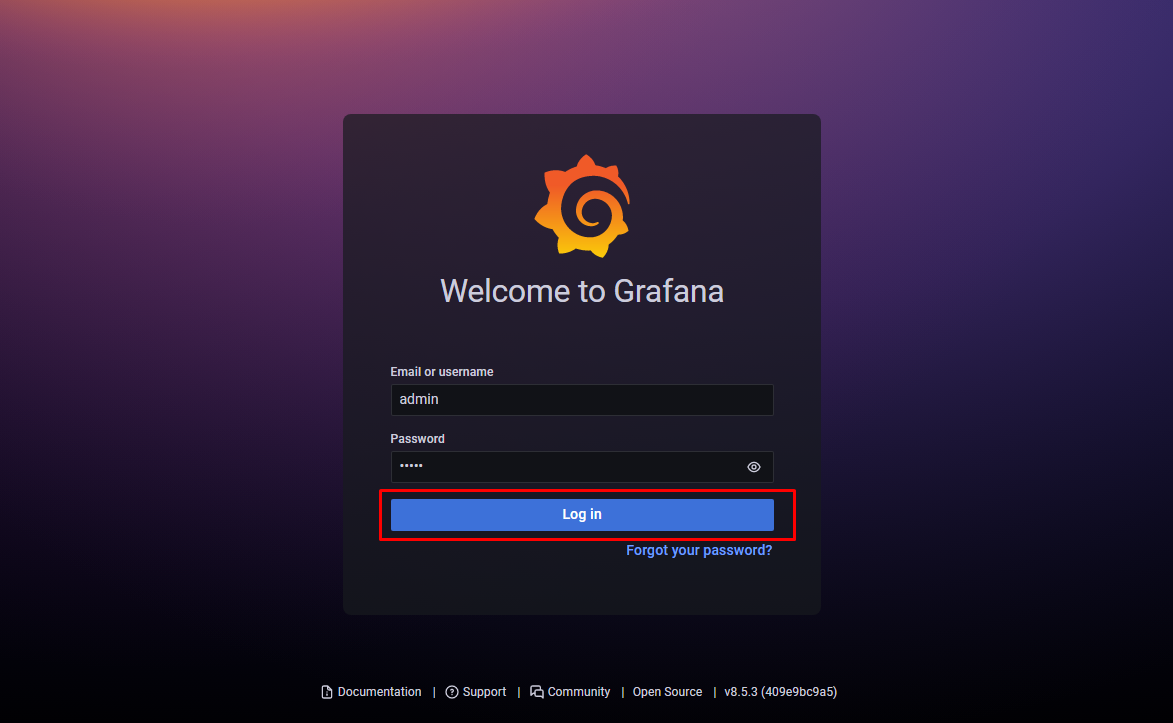
As the default password is insecure, you will need to change it in the next step.
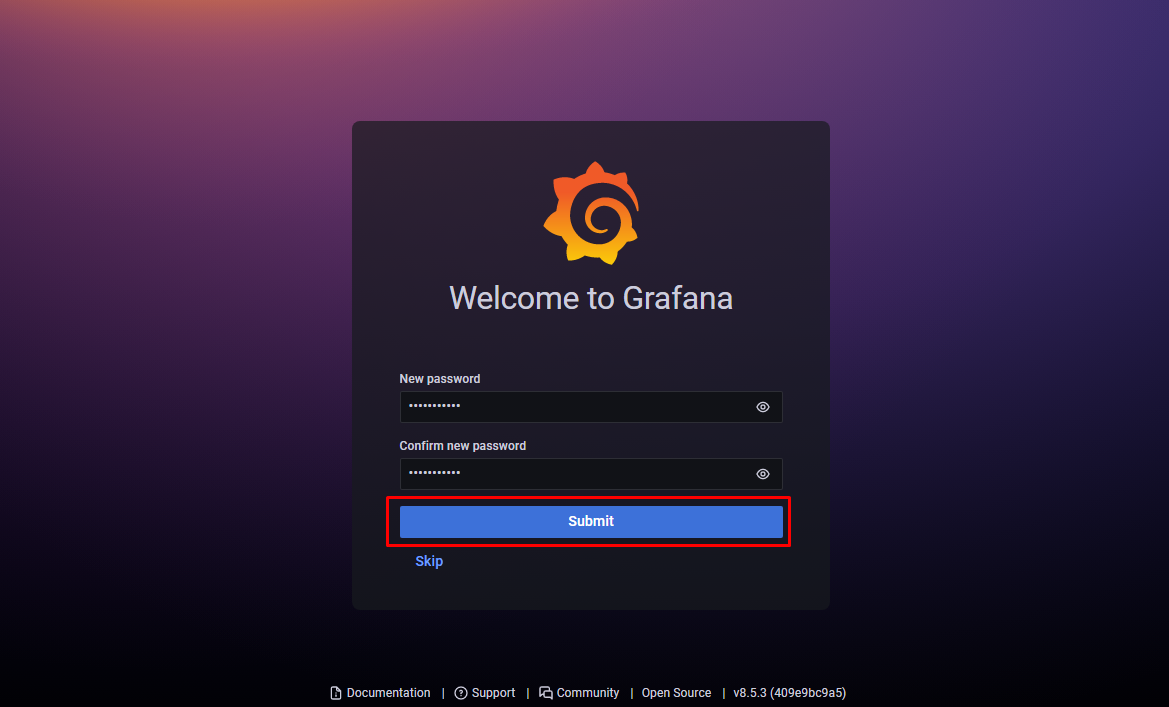
As soon as you click on the “Submit” button, you will be able to see the Grafana dashboard on your browser.
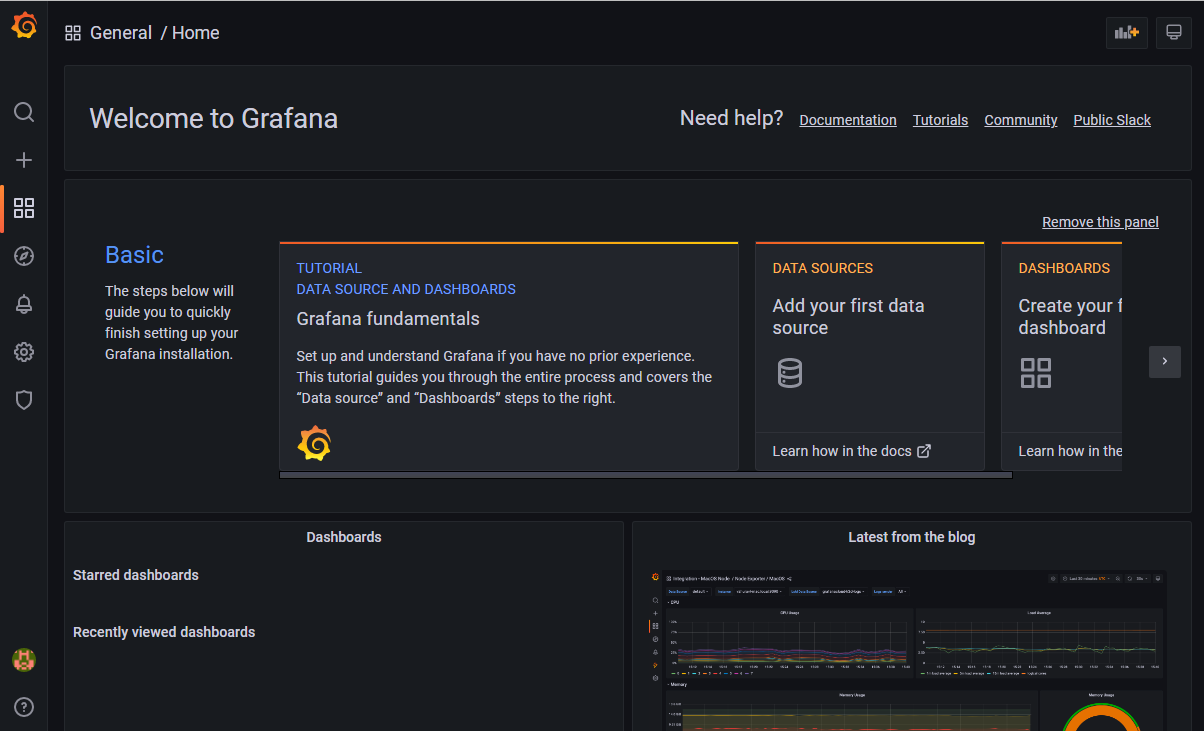
This completes the Grafana installation on your Raspberry Pi device. In case you need assistance, go to the Grafana documentation to acquire the basic understanding of using this tool.
Conclusion
Grafana is a robust web-based application designed specially to visualize time-series data. It includes an online dashboard where you can see different options to view your Raspberry Pi board’s performance. It can easily be installed on Raspberry Pi using the source key and repository that needs to be added to the system packages list. Afterwards, you can access its dashboard on your browser’s tab through the device IP address.
Source: linuxhint.com