How to Fit Curve or Surface to Data in MATLAB Using fit
Fitting data into curves and surfaces is a process of approximating data to the given data points. If we have small data, we will have a bad approximation while for the large data points, we will have a good approximation.
Curve or surface fitting is a complicated task that consumes time to perform manually. However, MATLAB has introduced a built-in fit() function that performs curve and surface fitting in MATLAB.
This guide is going to explore how to fit a curve or a surface to the data points using the fit() function in MATLAB.
How to Fit Curve or Surface to the Data Points in MATLAB?
MATLAB facilitates us with a built-in fit() function that enables us to fit data points to the curve or surface. This function accepts scalar or vector-valued data points as a mandatory input and returns an approximated curve or surface fit to the given data points.
Syntax
In MATLAB, you can use the fit() function in the following ways:
fitobject = fit([x,y],z,fitType)
fitobject = fit(x,y,fitType,fitOptions)
Here,
The function fitobject = fit(x,y,fitType) yields a curve fit to the given scalar data in x and y with the specified model fitType.
The function fitobject = fit([x,y],z,fitType) yields a surface fit to the given data in vectors x, y, and z with the specified model fitType.
The function fitobject = fit(x,y,fitType,fitOptions) yields to create a fit to the given data using the specified algorithm option fitOptions.
Examples
Follow the given examples to explore the working of the fit() function to fit a curve or a surface to the given data points in MATLAB.
Example 1: How to Fit a Quadratic Curve in MATLAB?
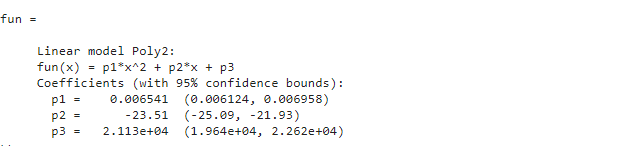
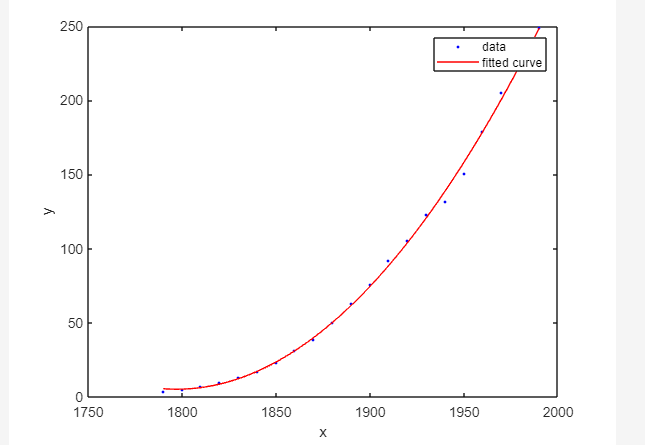
In the given example, we load data “census” and fit the quadratic curve to the defined variables cdate and pop using the fit() function. After that, we plot the fitted curve and the data.
fun=fit(cdate,pop,‘poly2’)
plot(fun,cdate,pop)
Example 2: How to Fit Polynomial Surface in MATLAB?
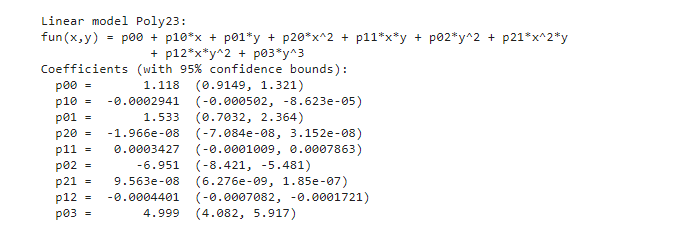
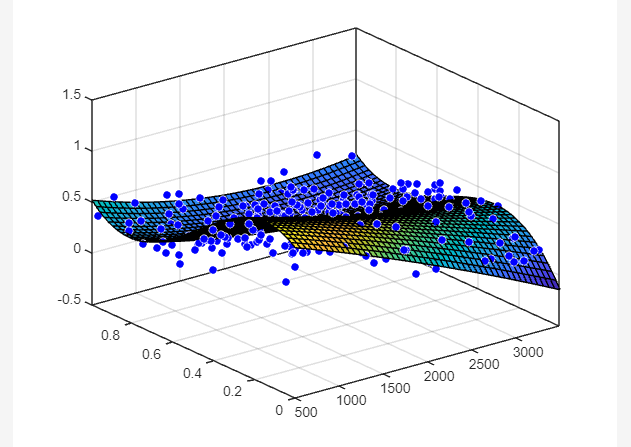
In the given MATLAB code, we load data “franke” and fit the surface to the defined variables x, y, and z using the fit() function. After that, we plot the fitted curve and the data.
fun = fit([x, y],z,‘poly23’)
plot(fun,[x,y],z)
Conclusion
MATLAB includes a built-in fit() function to fit data to the curve or surface; this function is used for data approximation by fitting the curve in the given data points. For small data, the approximation will be bad while for large data approximation will be good. This guide presented the curve and surface fitting to the given data points using the fit() function in MATLAB.
Source: linuxhint.com