How to Display Image using Matplotlib “imshow()” Method
Like other programming languages, Python’s developers can also use different libraries for Image visualization, and “matplotlib” is one of them that includes multiple built-in functions/methods for representing different graphs, plots, and images. It is built over the “numpy” library. The most popular function of the “matplotlib” library is plt.imshow()”, which is used for displaying the images.
This guide will talk about the “imshow()” method in Python.
Displaying Image Using Matplotlib “imshow()” Method – Python
The “matplotlib” package is most commonly used for visual analytics as well as for graphics including data. Its “plt.imshow()” method is used for showing the graphics.
Let’s have a look at the below-provided examples for understanding the usage of the “imshow()” method.
Example 1: How to Show the Image Using Matplotlib “imshow()” Method in Python?
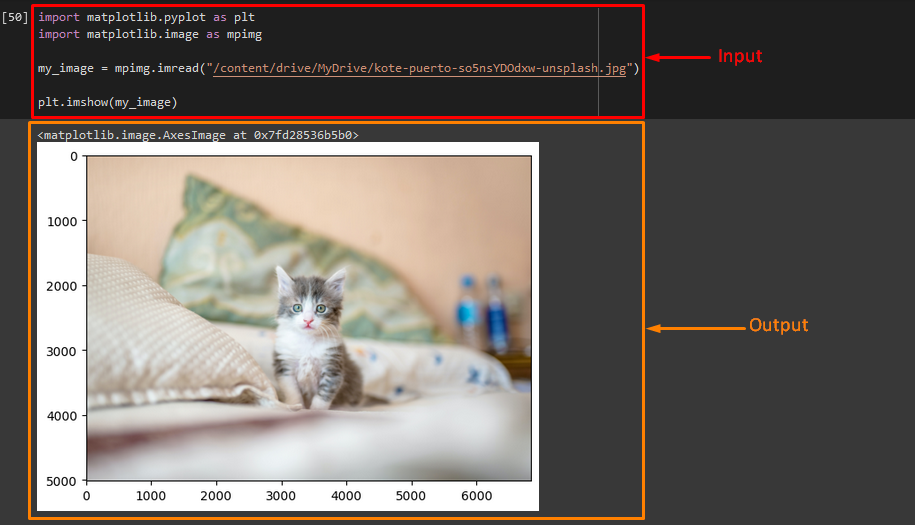
To show the image using the “imshow()” method, first import the required libraries, such as “matplotlib.pyplot” and “matplotlib.image”:
import matplotlib.image as mpimg
Then, load any image that you want to show by providing its path inside the “mpimg.imread()” method and save it into the variable. Here, our desired image is located on our Google Drive:
Now, invoke the “plt.imshow()” method to show the image and pass it the variable that holds the loaded image:
It can be seen that our specified image has been shown successfully:
Example 2: How to Convert Image into Grayscale Using Matplotlib “imshow()” Method in Python?
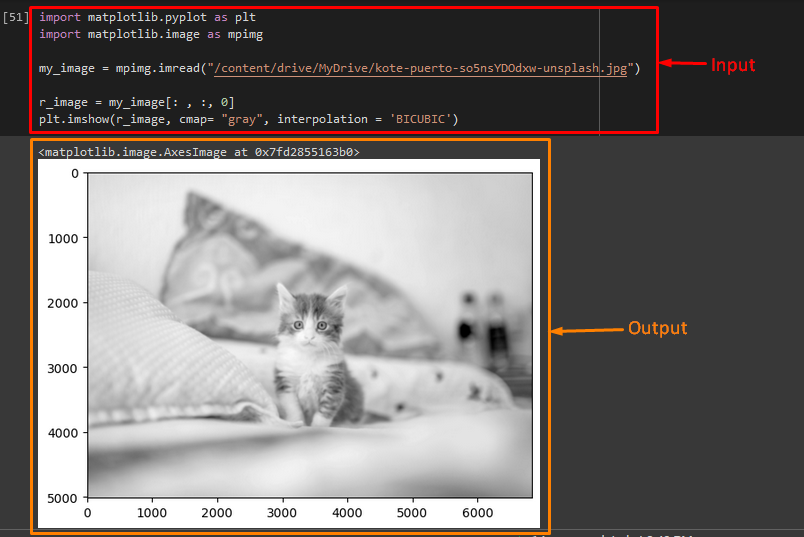
First, convert the image into an array and pass it to a variable. Then, call the “plt.imshow()” method, pass the variable that holds the array, the “cmap” parameter with value as “gray”. The cmap is a colormap instance or registered colormap name, and the “interpolation” parameter with “BICUBIC” as its value is utilized for displaying an image:
plt.imshow(r_image, cmap= "gray", interpolation = ‘BICUBIC’)
It can be seen that the provided image has been converted into the grayscale:
Example 3: How to Change the Image Origin Using Matplotlib “imshow()” Method in Python?
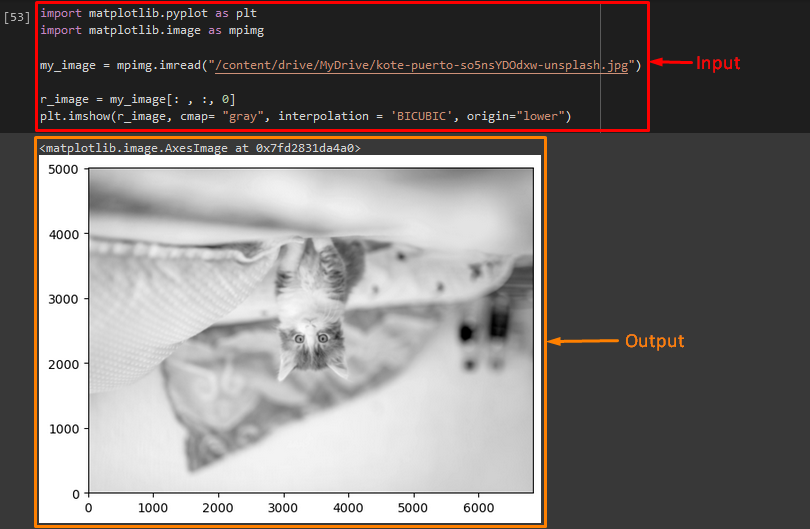
By using the “imshow()” method, users can also adjust the image’s origin. To do so, the “origin” parameter can be utilized. Here, we have specified “lower” as the value of the “origin” parameter:
It can be observed that the origin of the specified image has been changed:
That’s it! We have briefly explained about the matplotlib “imshow()” method in Python.
Conclusion
The “matplotlib” library contains multiple methods/functions that are used for data visualization, such as graphs, plots, and images with the help of number arrays. The most commonly used method of the “matplotlib” library is the “imshow()” method which uses the image objects. This post demontstrated about the Python’s matplotlib “imshow()” method.
Source: linuxhint.com