How to Detect Memory Leaks in C/C++ with Valgrind
When you run a program under Valgrind, it dynamically instruments the program’s executable, allowing it to monitor the program’s memory usage and execution behavior.
Memory Leaks in C++
It’s important to note that Valgrind is primarily designed for C and C++ programs and may not work as effectively with other languages or in all scenarios. Additionally, running a program under Valgrind can significantly slow down its execution, so it is often used during development and debugging rather than in production environments.
When a dynamically created memory is not properly released, it can cause memory leaks in C/C++ which will slowly drain the available memory resources. This can result in excessive memory consumption and degraded performance of the program.
Valgrid Installation
To install Valgrind on a Linux system, open a terminal and update your package repositories using the package manager that is specific to your Linux distribution. The following command works for Ubuntu and Debian-based systems:
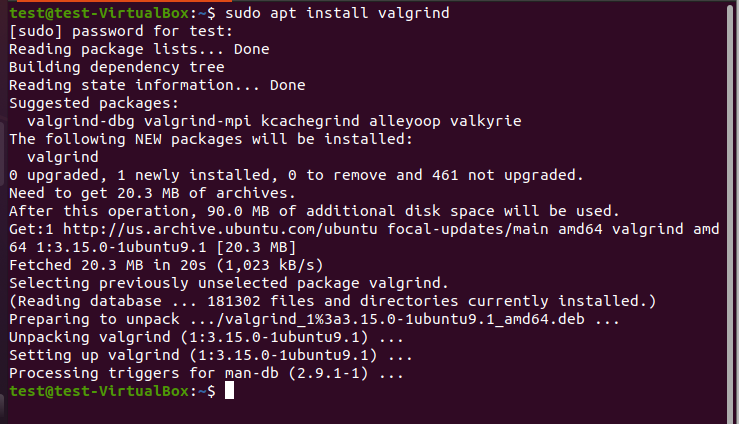
Use the package manager to install Valgrind. Again, the command may vary depending on your Linux distribution. Use the following command for Ubuntu and Debian-based systems:
When prompted, enter your user password and press “Enter”. Note that your user account needs administrative privileges to install the software. The package manager downloads and installs Valgrind along with any necessary dependencies. The process may take a few minutes.
After the installation process is finished, you can confirm the successful installation of Valgrind by executing the following command as a verification step:
This command displays the version information of Valgrind if it is installed successfully.
That’s it! Valgrind should now be installed on your Linux system, and you can use it to analyze and debug your C/C++ programs for memory leaks and other issues.
Creating a File in Ubuntu
To start working on the program, we first need to create a file in Ubuntu. For file creation, we use the nano text editor. So, we write the command on the terminal as follows:
Here, nano is the name of the text editor that is being executed. The “file1” argument represents the name of the file that you intend to open or create using the nano text editor. Nano opens the file for editing if it already exists; if not, it generates a new file with the supplied name. Since we do not have such a file, it creates a new document with the name, “file1”.
Once you run the command, the nano editor will open, providing you with a blank canvas to enter or edit the content of the “file1” file. You can start typing or pasting the existing content into the editor.
Now that all prerequisites are achieved, we create some examples to use Valgrind to detect the memory leaks in C++ programs.
Example 1:
The first example that we provide demonstrates a simple example of dynamic memory allocation using the “malloc” function from the <stdlib.h> library in C.
Here’s a breakdown of the code:
We first include the standard library header file <stdlib.h> which provides the functions like malloc for dynamic memory allocation and deallocation.
The int main() line declares the main function. Then, the char *a = malloc(102); declares a pointer variable “a” of type char* (pointer to char). It uses the “malloc” function to dynamically allocate the memory for an array of 102 char elements (102 bytes in total). The memory allocation size, expressed in bytes, is sent as an input to the malloc function and it outputs a pointer to the freshly created memory block. The char* pointer “a” is assigned this pointer value. Lastly, the “return 0;” signifies the end of the main function.
In short, this code dynamically allocates the memory for an array of 102 char elements using “malloc” and assigns the memory address to the pointer “a”. However, note that the code does not use or manipulate the allocated memory in any way and does not include deallocation of the memory using free.
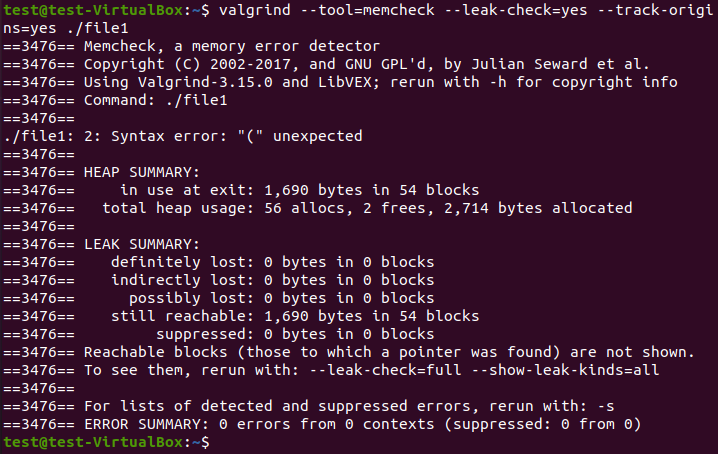
When we run this program through Valgrind with the “–leak-check=full” option, it performs a memory leak check and provides an output report.
The output report that is produced by Valgrid is given as follows:
Example 2:
To begin with this illustration, we first create a “test2” file using the nano text editor as explained previously by writing the command:
Now, we write a C++ program to check if there is any memory leak using Valgrind:
#include <stdio.h>
#include <time.h>
const int a_s = 3000;
int main() {
int *ia = malloc(sizeof(int) * a_s);
for (int i = 0; i < a_s; i++) {
ia[i] = i;
}
srand(time(NULL));
int rn = rand() % a_s;
printf("ia[%d]: %d\n", rn, ia[rn]);
return 0;
}
Let’s get through the program.
The code includes the necessary header files and defines the “a_s” constant variable with a value of 3000. Inside the main() function, a pointer “ia” of type int* is declared and the memory is dynamically allocated using the “malloc” function. The “sizeof(int) * a_s” expression determines the total required memory to store the “a_s” number of integers. All of the elements of the “ia” array are initialized by the “for” loop with its corresponding index value. For example, ia[0] will be 0, ia[1] will be 1, and so on.
The random number generator is seeded using the “srand” function using the current time. This makes sure that the program produces a unique set of random integers each time it is executed. The “rand” function generates a random number, and “rn” is assigned with the result of rand() % a_s. The modulus operator “%” limits the range of the random number to be between 0 and a_s – 1 which corresponds to a valid index within the “ia” array.
Finally, the program uses the “printf” function to print the value at the randomly selected index “rn” of the “ia” array, along with the corresponding index.
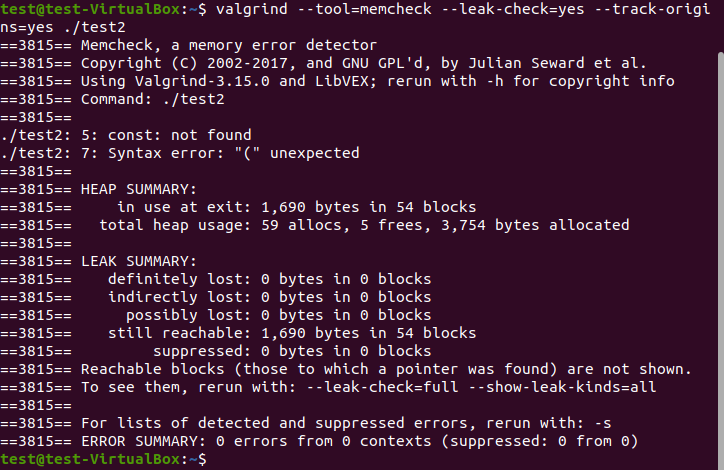
When you run this program through Valgrind, it generates the following output report:
Conclusion
We discovered the utilization of the Valgrind tool to detect the memory leaks in a C++ program. The installation guide of the Valgrind is provided initially. After that, we elaborated on the creation of a file in Ubuntu using the nano text editor. In the end, using these prerequisites, we executed two C++ examples to check the memory leaks in them. The report that is generated by Valgrind is also attached which shows the memory leaks in the provided file.
Source: linuxhint.com