How to Calculate Power Spectral Density in MATLAB
This blog is going to make discussions about the calculations of the power spectral density in MATLAB.
How to Calculate Power Spectral Density in MATLAB?
As discussed earlier, we can calculate the power spectral density in MATLAB using the periodogram() function. This function accepts the signals as mandatory input and calculates and plots the power spectral density corresponding to the input signals.
Syntax
In MATLAB, you can implement the periodogram() function in the following ways:
pxx = periodogram(x,window)
pxx = periodogram(x,window,nfft)
[pxx,w] = periodogram(x,window,w)
[pxx,f] = periodogram(x,window,f,fs)
Here:
The function pxx = periodogram(x) is responsible for providing the periodogram spectral density estimate corresponding to the given input signal x can be found using the rectangular window.
- If x represents a vector, this will treat it as a signal channel.
- If x represents a matrix, this function will treat each column independently to compute periodogram spectral density PSD and store its computed value in the corresponding column of pxx.
- If x represents a real-valued vector or matrix, this function will compute pxx as a one-sided PSD estimate.
- If x represents a complex-valued vector or matrix, this function will compute pxx as a two-sided PSD estimate.
The function pxx = periodogram(x,window) is responsible for providing the modified periodogram spectral density estimate corresponding to the given input signal x using the window “window”, where the window represents a vector having the same length as x.
The function pxx = periodogram(x,window,nfft) is responsible for using the nfft points in the discrete fourier transformation.
- If nfft points are greater than the length of the signal x, x will be zero-padded to its length.
- If nfft points are less than the length of the signal x, x will be wrapped modulo nfft and will sum up using the datawrap.
The function [pxx,w] = periodogram(x,window,w) is responsible for providing the two-sided periodogram estimate at the specified frequencies represented by the vector w. It is recommended that the vector w must hold at least two points, otherwise, it will be interpreted as nfft by the function.
The function [pxx,f] = periodogram(x,window,f,fs) is responsible for providing the two-sided periodogram estimate at the specified frequencies represented by the vector f. It is recommended that the vector f must hold at least two points, otherwise, it will be interpreted as nfft by the function. The frequencies contained by the vector f represent cycles per unit time and the variable fs represent the sample count per unit time.
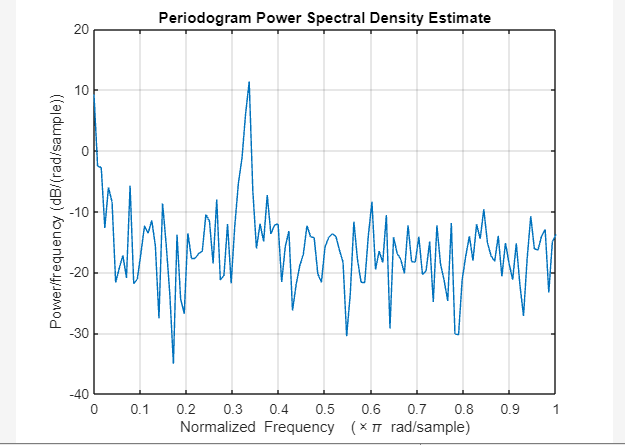
Example 1: How to Plot Calculated Periodogram Power Spectral Density in MATLAB?
This MATLAB code uses the periodogram() function to compute the power spectral density and plot it using the plot() function.
x = cos(pi/3*n)+rand(size(n));
periodogram(x)
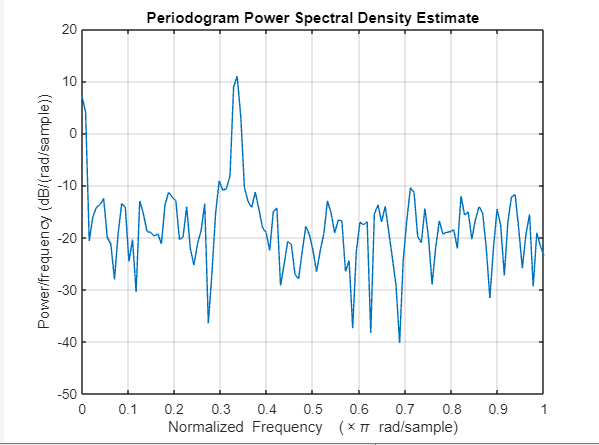
Example 2: How to Plot Modified Periodogram Power Spectral Density with Hamming Window in MATLAB?
In this example, we use the periodogram() function to create the plot of the periodogram power spectral density having the hamming window.
x = cos(pi/3*n)+rand(size(n));
periodogram(x,hamming(length(x)))
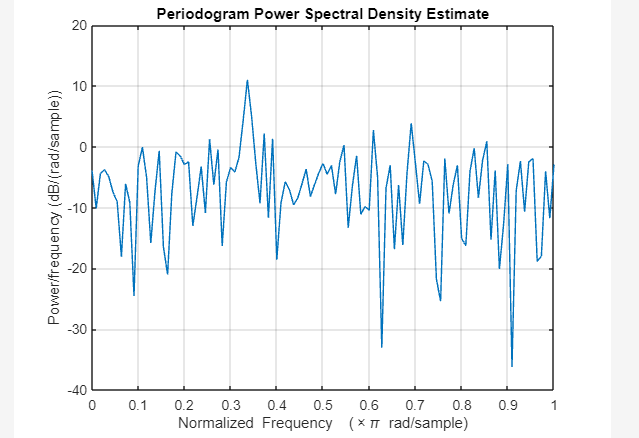
Example 3: How to Plot Periodogram Power Spectral Density with DFT Length Equal to Signal Length in MATLAB?
In this MATLAB code, we create a plot for the periodogram power spectral density by equating the DFT length to the signal length using the periodogram() function.
x = cos(pi/3*n)+randn(size(n));
nfft = length(x);
periodogram(x,[],nfft)
Conclusion
The power spectral density represents the energy variation’s strength in terms of frequency. It is the domain of physics and engineering widely used for weaker and stronger frequency detection and broadband random signal characterization. MATLAB enables us to calculate power spectral density using the periodogram() function. This guide has presented the implementation of the periodogram() function along with different syntaxes and examples to help you calculate power spectral density in MATLAB.
Source: linuxhint.com