How to Annotate Graph in MATLAB
This tutorial is going to teach how to annotate a graph in MATLAB using the built-in annotation() function.
How to Annotate Graph in MATLAB
We can easily perform graph annotation in MATLAB using the built-in annotation() function. This function takes some necessary and optional parameters and creates annotation on your MATLAB graph.
Syntax
In MATLAB, you can use the annotation() function in the following ways:
annotation(lineType)
annotation(shapeType,dim)
annotation(shapeType)
Here:
- The function annotation(lineType,x,y) is responsible for creating the line or arrow annotation that excited between two points x and y in the current figure. We can specify the lineType variable as an arrow, line, text arrow, or double arrow. And x and y represent two element vectors.
- The function annotation(lineType) is responsible for the creation of annotation in the default position lying between the points (0,3,0,3) and (0,4,0,4).
- The function annotation(shapeType,dim) is responsible for creating the annotation having the ellipse, textbox, or rectangular shape with the specified size or location in the current figure. The variable dim represents the four-element vector [x y w h], where x and y determine the location while w and h determine the size.
- The function annotation(shapeType) is responsible for creating the annotation in the default position in such a way the left corner is at (0.3,0.3) and the height and width are 0.1.
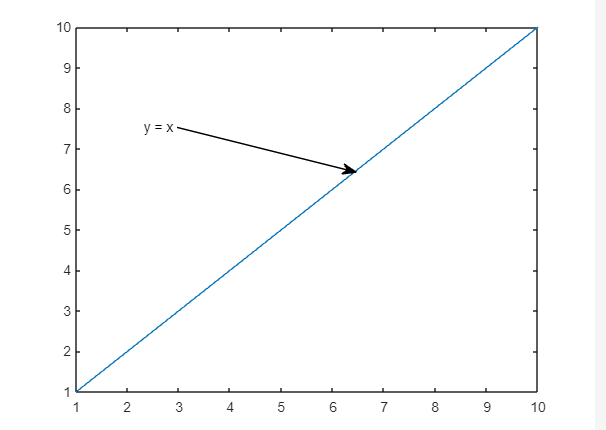
Example 1: How to Create Text Arrow Annotation Between Two Given Points
This MATLAB code uses the annotation() function to create a text arrow annotation by adding text description, starting from the point [0.3,0.6] and ending at the point [0.7,0.6].
plot(1:10)
% Starting and Ending points for the Text Arrow
x = [0.3 0.6];
y = [0.7 0.6];
%Specify the Text Arrow
annotation(‘textarrow’,x,y,‘String’,‘y = x ‘)
Note: You have to specify the arrow start and end value according to yourself.
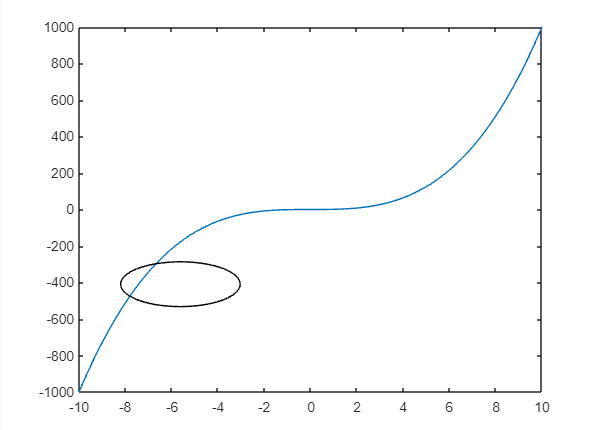
Example 2: How to Create Ellipse Annotation for the Given Dimension
In this MATLAB code, we create an ellipse annotation corresponding to the given dimension dim using the annotation() function.
x = linspace(–10,10);
y = x.^3;
plot(x,y)
dim = [.2 .3 .20 .10];
annotation(‘ellipse’,dim)
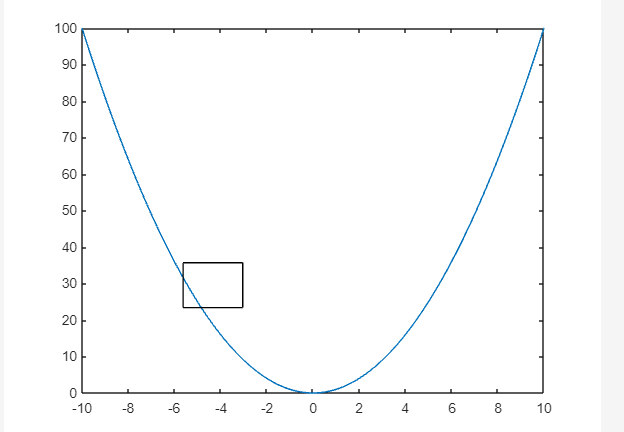
Example 3: How to Create Rectangular Annotation for the Default Dimension
The given example uses the annotation() function to create rectangular annotation for the default dimension in the current figure.
x = linspace(–10,10);
y = x.^2;
plot(x,y)
annotation(‘rectangle’)
Conclusion
Annotating a graph is a helpful way for graph understanding and interpretation. It assists the reader in understanding the context and presenting arguments in the graph. MATLAB provides us with a built-in annotation() function that annotates the graph according to the specified options. This tutorial has presented the implementation of the annotation() function along with the syntaxes and examples for better understanding.
Source: linuxhint.com