D3.js Shapes – Arcs
D3.js is available and free which is an open-source JavaScript library for 3D interactive Data visualizations with Scalable Vector Graphics (SVG). One of the easier ways without any kind of modules/software is using the D3.js link – https://d3js.org/d3.v3.min.js – within the script tag.
D3.js Shapes – Arcs
In D3.js, the arc is a generator that produces a circular sector. There are some few points that we need to know before generating arc in D3.js.
- It produces a complete circle if the difference between the start angle and the end angle is greater than 2π (180 degrees).
- The arc’s angular length is equal to the difference between the two (start and end) angles is less than 2π.
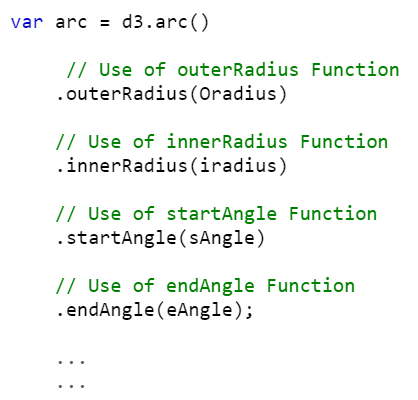
- arc() – The arc generator is created using this function. By default, the innerRadius = 0, outerRadius = 100, startAngle = 0, and endAngle = π/2.
Syntax:
We can assign this to a variable of “const” or “var” type.
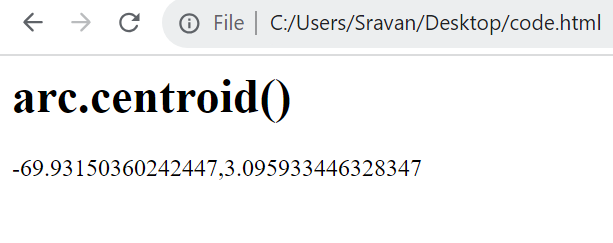
1. arc.centroid(…arguments) – The midpoint [x, y] of the centerline of the arc that is generated by the given arguments using this function. The (startAngle + endAngle) / 2 and (innerRadius + outerRadius) / 2 is the computation for the midpoint.
Syntax:
It may take the arbitrary arguments and return the array of two points.
1. arc.innerRadius(radius) – It can be possible to set the inner radius for the arc using the innerRadius() function. It takes the radius as the parameter
Syntax:
Pass the value as a radius to this function.
1. arc.outerRadius(radius) – Similar to innerRadius, we can set the outer radius for the arc using the outerRadius() function. It takes the radius as the parameter.
Syntax:
Pass the value as a radius to this function.
1. arc.cornerRadius(radius) – It sets the corner radius and returns the arc generator. The corners of the arc are rounded using the circles if the radius (parameter) is greater than 0. Two outer corners are rounded for a circular sector and the four corners are rounded for an annual sector.
Syntax:
Pass the value as a radius to this function.
1. arc.startAngle(angle) – It is possible to set the start angle to the specified function using the arc.startAngle() function. It takes the angle as the parameter.
Syntax:
Pass the angle to this function.
Example:
1. arc.endAngle(angle) – Similar to the startAngle, the endAngle is specified using the arc.endAngle() function. It takes the angle as the parameter.
Syntax:
Pass the angle to this function.
Example:
Creation of Arc
Step 1: Create an SVG image with the height and width attributes.
![]()
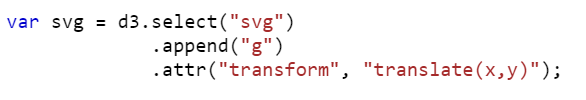
Step 2: Select the previous “svg” element by specifying it within the d3.select() function and append “g”. Here, the “g” element is used to group the SVG shapes together. Also, translate them by specifying the attr (“transform”, “translate(x,y)”) property.
Step 3: It’s time to use the d3.arc() function to generate arc with the innerRadius, outerRadius, etc.
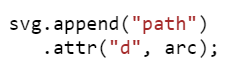
Step 4: D3 uses a path generator for arcs. So, we need to specify the created arc with the “d” attribute. Here, we append the “path” to SVG.
Example 1:
Let’s generate an arc with the innerRadius, outerRadius, startAngle, and endAngle.
Let’s look at the script first.
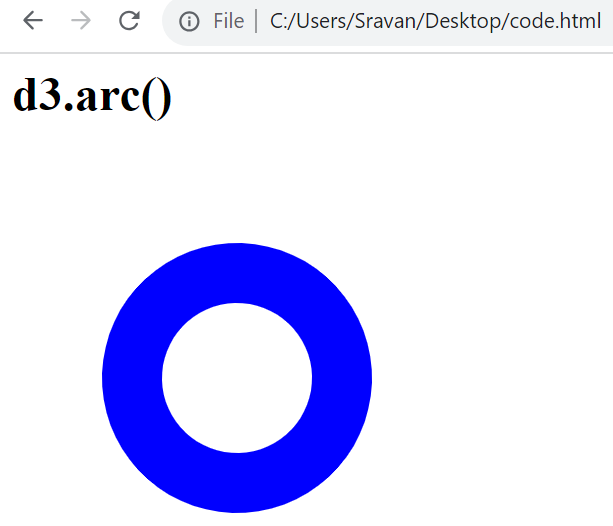
1. Create the arc_generator with the innerRadius = 50, outerRadius = 90, startAngle = 45, and endAngle = 90.
2. Append the path and arc_generator to the SVG. Set the color as blue and append this to SVG.
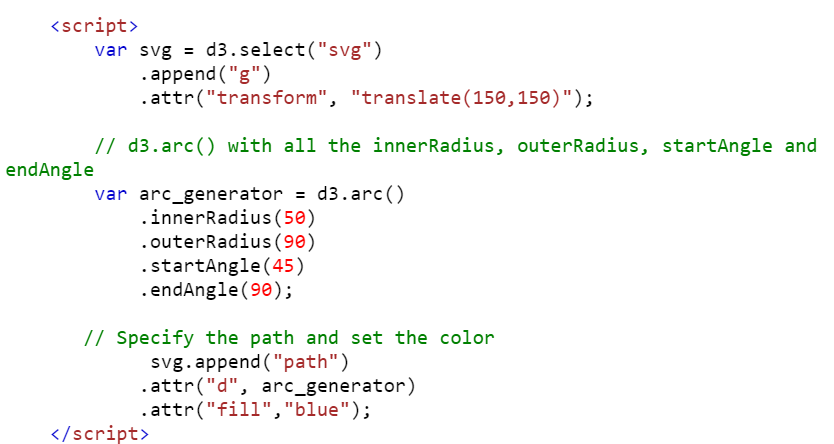
Entire Code:
<head>
<script src="https://d3js.org/d3.v6.min.js"></script>
</head>
<body>
<h1>d3.arc()</h1>
<svg width="500" height="500">
</svg>
<script>
var svg = d3.select("svg")
.append("g")
.attr("transform", "translate(150,150)");
// d3.arc() with all the innerRadius, outerRadius, startAngle and endAngle
var arc_generator = d3.arc()
.innerRadius(50)
.outerRadius(90)
.startAngle(45)
.endAngle(90);
// Specify the path and set the color
svg.append("path")
.attr("d", arc_generator)
.attr("fill","blue");
</script>
</body>
</html>
Output:
Example 2:
In this example, we generate an arc and return the centroid.
<head>
<script src="https://d3js.org/d3.v6.min.js"></script>
</head>
<body>
<h1>arc.centroid()</h1>
<script>
// d3.arc() with all the innerRadius, outerRadius, startAngle and endAngle
var arc_generator = d3.arc()
.innerRadius(50)
.outerRadius(90)
.startAngle(45)
.endAngle(90);
// arc.centroid()
document.write(arc_generator.centroid());
</script>
</body>
</html>
Output:
Example 3:
Utilize Example 1 and change the script with the following script. Here, we include the “.cornerRadius(6666)”:
var svg = d3.select("svg")
.append("g")
.attr("transform", "translate(150,150)");
var arc_generator = d3.arc()
.outerRadius(10)
.innerRadius(110)
.startAngle(0)
// d3.arc() with cornerRadius
.cornerRadius(6666)
.endAngle(1);
svg.append("path")
.attr("d", arc_generator)
.attr("fill","blue");
</script>
Output:
D3.js Shapes – Curves
In D3.js, curves are used to view the continuous data points. Basically, they turn the discrete representation of a line into a continuous shape. If you want to construct a curve, it is not directly possible. They are passed to the area or line. Let’s see some important methods such that the closed/open curves can be generated from the given data points.
1. curveBasis() – The cubic basis splines are produced by this method. Here, the data points provided to the generators are used as the control points. It does not take any parameter.
Syntax:
Look at the syntax of the curveBasic() method:
curveBasisClosed() – We can create a closed curve using this method.
Syntax:
Look at the syntax of the curveBasicClosed() method:
curveBasisOpen() – This method produces the cubic basis splines. In this scenario, the first points and last points are not repeated.
Syntax:
Look at the syntax of the curveBasicOpen() method:
curveBumpX() – This method produces the Bézier curve (it is basically a parametric curve which is used in computer graphics) between each pair of points with a horizontal tangent at each point.
Syntax:
Look at the syntax of the curveBumpX() method:
curveBumpY() – It is similar to the previous method but produces the Bézier curve (it is basically a parametric curve which is used in computer graphics) between each pair of points with a vertical tangent at each point.
Syntax:
Look at the syntax of the curveBumpY() method:
curveLinear() – Polyline is produced through the specified points. It won’t take any parameter.
Syntax:
Look at the syntax of the curveLinear() method:
curveLinearClosed() – Closed Polyline is produced through the specified points. It won’t take any parameter. Here, the first point is repeated when the line segment ends.
Syntax:
Look at the syntax of the curveLinearClosed() method:
Creation of Curves
We use lines for the curves in all the examples.
Step 1: The SVG image with height and width attributes is created.
![]()
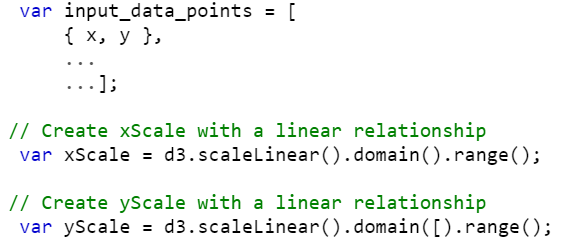
Step 2: The data points (input_data_points) have to be declared. Each pair holds the “x” and “y” points, then the createScales for “x” and “y” with a linear relationship using the d3.scaleLinear() function with some range.
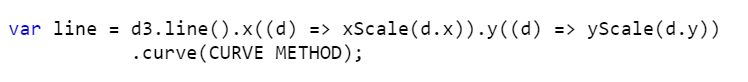
Step 3: Create a line with a curve using the d3.line.curve() method from the previous points and use the curve methods.
1. The d3.line.x() method is utilized to set the “x” accessor point and the d3.line.y() method is utilized to set the “y” accessor point.
2. Then, we need to pass the curve() such that the curve is given to the line based on the provided curve method.
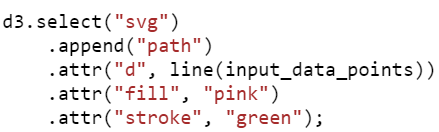
Step 4: Select the previous “svg” element by specifying it within the “d3.select()” function and append “path”. Also, specify the line with the data points and it is optional to shade the curve by specifying the “fill” attribute and curve surrounding color using the “stroke” attribute.
Example 1: CurveBasis()
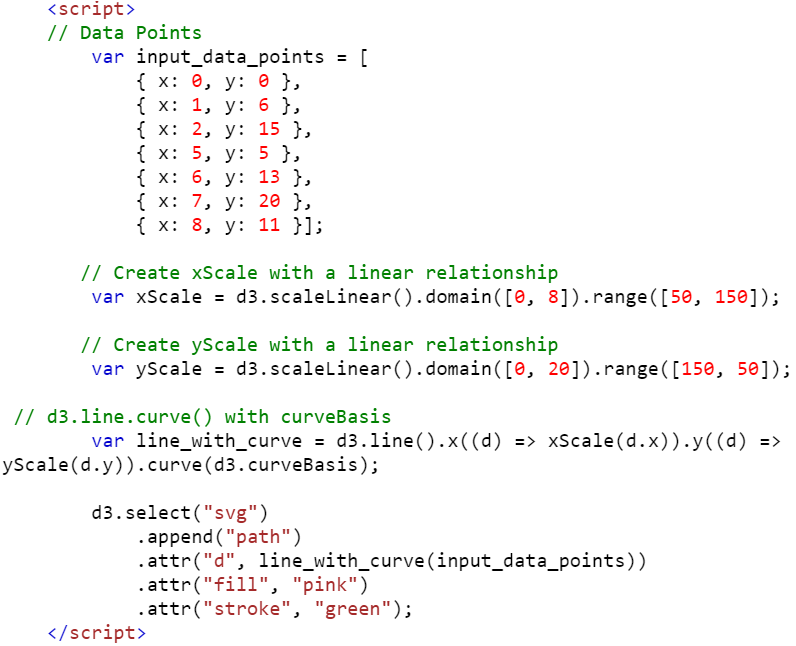
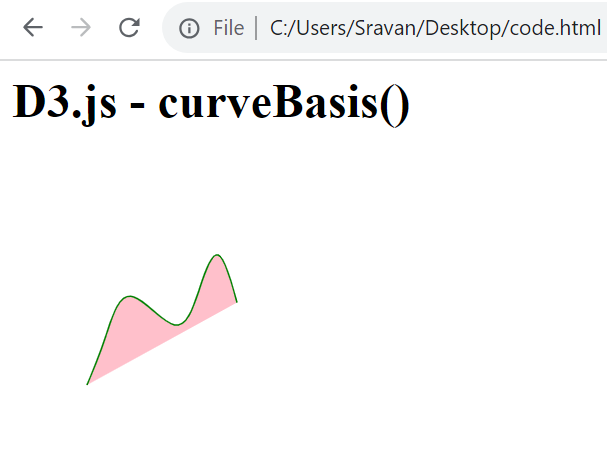
Let’s generate a line curve with the curveBasis() method. Here, the total number of data points is 7 and the generating line curve is “pink” with a stroke of “green”.
The script is shown in the following:
Entire Code:
<head>
<script src="https://d3js.org/d3.v6.min.js"></script>
</head>
<body>
<h1>D3.js – curveBasis()</h1>
<svg width="230" height="250"></svg>
<script>
// Data Points
var input_data_points = [
{ x: 0, y: 0 },
{ x: 1, y: 6 },
{ x: 2, y: 15 },
{ x: 5, y: 5 },
{ x: 6, y: 13 },
{ x: 7, y: 20 },
{ x: 8, y: 11 }];
// Create xScale with a linear relationship
var xScale = d3.scaleLinear().domain([0, 8]).range([50, 150]);
// Create yScale with a linear relationship
var yScale = d3.scaleLinear().domain([0, 20]).range([150, 50]);
// d3.line.curve() with curveBasis
var line_with_curve = d3.line().x((d) => xScale(d.x)).y((d) => yScale(d.y)).curve(d3.curveBasis);
d3.select("svg")
.append("path")
.attr("d", line_with_curve(input_data_points))
.attr("fill", "pink")
.attr("stroke", "green");
</script>
</body>
</html>
Output:
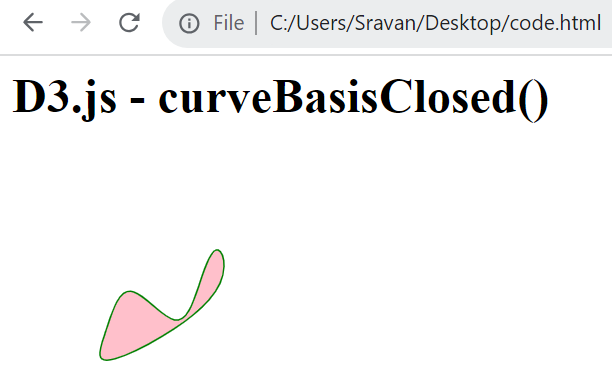
Example 2: CurveBasisClosed()
Utilize the script in Example 1 and change the method that is passed to the line.curve() method – curveBasis with curveBasisClosed. Also, change the text in heading 1 to D3.js curveBasisClosed().
The script is shown in the following:
// Data Points
var input_data_points = [
{ x: 0, y: 0 },
{ x: 1, y: 6 },
{ x: 2, y: 15 },
{ x: 5, y: 5 },
{ x: 6, y: 13 },
{ x: 7, y: 20 },
{ x: 8, y: 11 }];
// Create xScale with a linear relationship
var xScale = d3.scaleLinear().domain([0, 8]).range([50, 150]);
// Create yScale with a linear relationship
var yScale = d3.scaleLinear().domain([0, 20]).range([150, 50]);
// d3.line.curve() with curveBasisClosed
var line_with_curve = d3.line().x((d) => xScale(d.x)).y((d) => yScale(d.y)).curve(d3.curveBasisClosed);
d3.select("svg")
.append("path")
.attr("d", line_with_curve(input_data_points))
.attr("fill", "pink")
.attr("stroke", "green");
</script>
Output:
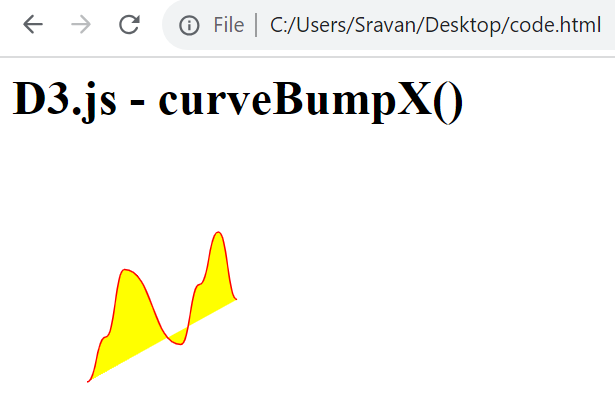
Example 3: CurveBumpX()
Utilize the script in Example 1 and change the method that is passed to the line.curve() method – curveBasis with curveBumpX. Also, change the text in heading-1 to D3.js curveBumpX().
The script is shown in the following:
// Data Points
var input_data_points = [
{ x: 0, y: 0 },
{ x: 1, y: 6 },
{ x: 2, y: 15 },
{ x: 5, y: 5 },
{ x: 6, y: 13 },
{ x: 7, y: 20 },
{ x: 8, y: 11 }];
// Create xScale with a linear relationship
var xScale = d3.scaleLinear().domain([0, 8]).range([50, 150]);
// Create yScale with a linear relationship
var yScale = d3.scaleLinear().domain([0, 20]).range([150, 50]);
// d3.line.curve() with curveBumpX
var line_with_curve = d3.line().x((d) => xScale(d.x)).y((d) => yScale(d.y)).curve(d3.curveBumpX);
d3.select("svg")
.append("path")
.attr("d", line_with_curve(input_data_points))
.attr("fill", "pink")
.attr("stroke", "green");
</script>
Output:
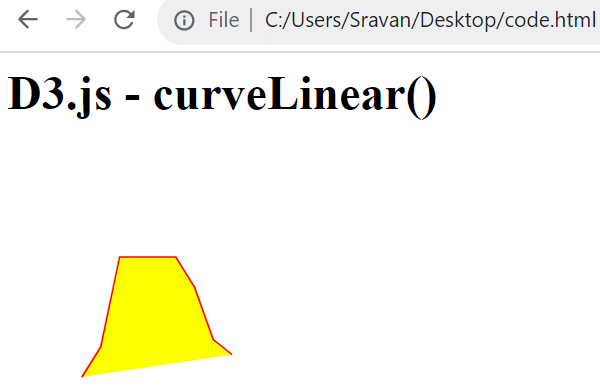
Example 4: CurveBumpX()
Utilize the script in Example 1 and change the method that is passed to the line.curve() method – curveBasis with curveLinear. Also, change the text in heading-1 to D3.js curveLinear(). Change the fill and stroke colors to “yellow” and “red”.
The script is shown in the following:
// Data Points
var input_data_points =[
{ x: 0, y: 0 },
{ x: 1, y: 4 },
{ x: 2, y: 16 },
{ x: 5, y: 16 },
{ x: 6, y: 12 },
{ x: 7, y: 5 },
{ x: 8, y: 3 }];
// Create xScale with a linear relationship
var xScale = d3.scaleLinear().domain([0, 8]).range([50, 150]);
// Create yScale with a linear relationship
var yScale = d3.scaleLinear().domain([0, 20]).range([150, 50]);
// d3.line.curve() with curveLinear
var line_with_curve = d3.line().x((d) => xScale(d.x)).y((d) => yScale(d.y)).curve(d3.curveLinear);
d3.select("svg")
.append("path")
.attr("d", line_with_curve(input_data_points))
.attr("fill", "yellow")
.attr("stroke", "red");
</script>
Output:
Conclusion
In D3.js shapes, the arcs and curves are the backbone for any kind of visualizations. In this guide, we provided learned how to generate arcs with different radius and different start and end angles. Then, we discussed how to generate curves on lines using the line.curve() method with examples. For each example, the script is separately provided as a screenshot with comments. While implementing the curves, make sure that you need to implement the first example and then replace the script from the other examples.
Source: linuxhint.com