Cumulative Percentage Pandas
“Cumulative Percentages” help you compare how many records are lower than a certain number in a group of records. For instance, if we have a group of students who took a test, the cumulative percentage shows us how many students got the same or lower score than a certain number. If you are working with data or math, finding cumulative percentages is an important feature.
In Python, you can easily find cumulative percentages using the “pandas” library. In this blog, we will show you how to get cumulative percentages in Python utilizing “pandas”.
How to Calculate/Find Cumulative Percentages Using Pandas in Python?
Follow the following steps to find the cumulative percentages using “pandas” in Python:
Step 1: Importing Required Libraries
The first step is to import the required library named “pandas” (used for data manipulation and analysis):
Step 2: Creating DataFrame
Now, let’s create a data frame to find cumulative percentages based on it:
df = pandas.DataFrame({‘year’: [11, 22, 33, 44, 55, 66],
‘sale’: [100, 175, 737, 847, 114, 234]})
print(df)
In the above code block, the “DataFrame” is created using the “pandas.DataFrame()” function having the stated values.
Output
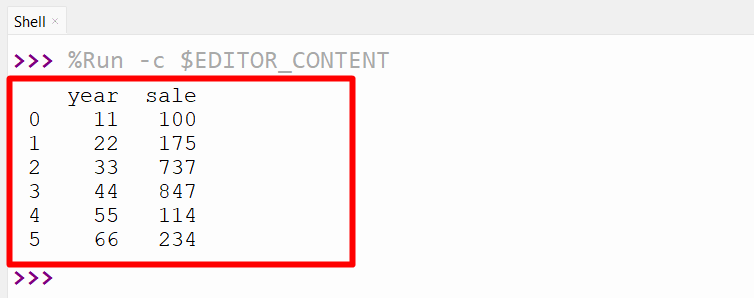
Based on the above output, the data frame has been created appropriately.
Step 3: Calculating Cumulative Percentages
To calculate cumulative percentages, we need to sort the data in ascending order and calculate the cumulative sum of the values. We can achieve this using the “cumsum()” function in Pandas. The “cumsum()” and “sum()” functions are used in Python to find the cumulative percentages.
Syntax
The syntax of the “cumsum()” function in Python pandas is shown below:
Here is the example code:
df = pandas.DataFrame({‘year’: [11, 22, 33, 44, 55, 66],
‘sale’: [100, 175, 737, 847, 114, 234]})
df_sorted = df.sort_values(‘sale’)
df_sorted[‘cumulative_sum’] = df_sorted[‘sale’].cumsum()
print(‘Cumulative Sum:’)
print(df_sorted)
total_sum = df_sorted[‘sale’].sum()
print(‘\nTotal Sum: ‘)
print(total_sum)
df_sorted[‘cumulative_percentage’] = 100 * df_sorted[‘cumulative_sum’] / total_sum
print(‘\nCumulative Percentage’)
print(df_sorted)
In the above code:
- The “pandas” library is loaded at the start.
- The “pandas.DataFrame()” function creates a data frame with two columns: “year” and “sale”, respectively.
- The “df.sort_values()” function is used to sort the data frame by the values in the “sale” column, from lowest to highest.
- The “cumsum()” function is used to create a new column in the sorted data frame named “cumulative_sum” and calculate the cumulative sum of the values in the “sale” column, which means adding up the values from top to bottom in an incremented manner.
- It is such that the previous value(s) will be appended as a sum to the next one and so on.
- Now, the “sum()” function calculates the total sum of the values in the “sale” column.
- After dividing each value in the “cumulative_sum” column by the total sum, the “cumulative percentage” of the values in the “sale” column is calculated.
Output
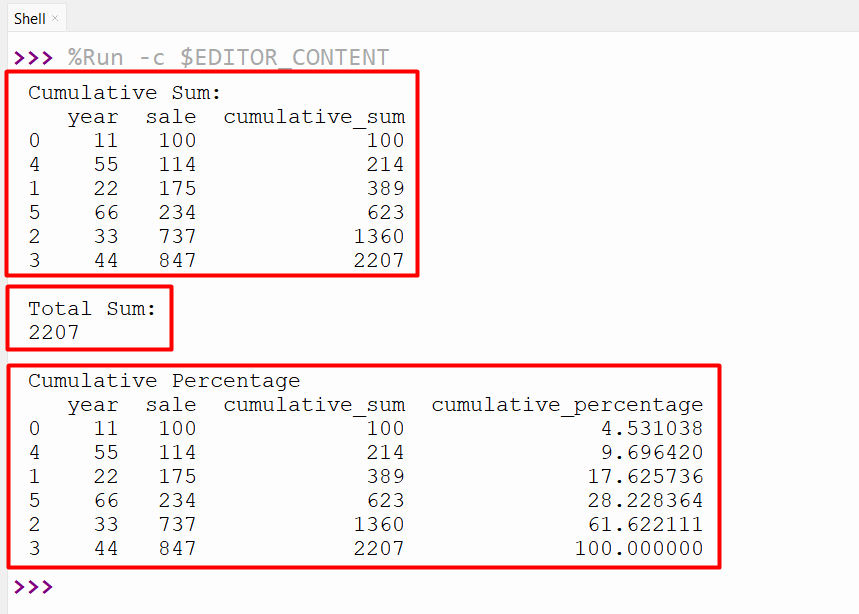
As analyzed, the cumulative sum, total sum, and cumulative percentage have been calculated, respectively.
Conclusion
The “cumsum()” and “sum()” functions are used in Python to find the cumulative percentages. The “cumsum()” function adds up the column’s values and the “sum()” function gives the total value of a column. The purpose of this Python article was to demonstrate how to find the cumulative percentage utilizing pandas.
Source: linuxhint.com