Creating MLflow Experiments: Quick Start
The MLflow tracking component records the logging parameters of code, its versions, output files, parameters, and metrics. Each MLflow experiment allows us to search, visualize, and compare the runs. Moreover, the run artifacts, along with the model’s metadata, can also be downloaded and analyzed on other platforms.
Now that you know the basics of MLflow, let’s build a simple machine-learning model to understand how MLflow Experiments work using Python API. We will also demonstrate the use of web UI to visualize the runs. We use the Jupyter Notebook for the Python code.
Let’s start with installing the prerequisites.
How to Install and Initialize MLflow
For MLflow experiment tracking, its web UI and Python library are used. Both of these components are installed using a single command.
To install MLflow in your system, open the command prompt or the Windows power shell and run the following command:
This installs the MLflow Python library on your system.
To install MLflow in the Jupyter environment, run the following command in the code cell:
Once the package is installed on your system, you can view the MLflow dashboard by running the following command in the command prompt or power shell:
This results in the following output:
![]()
Here, “http://127.0.0.1:5000” is the link to open the dashboard on your browser.

This dashboard allows you to create new experiments, register new models, search through previous experiments, and take notes.
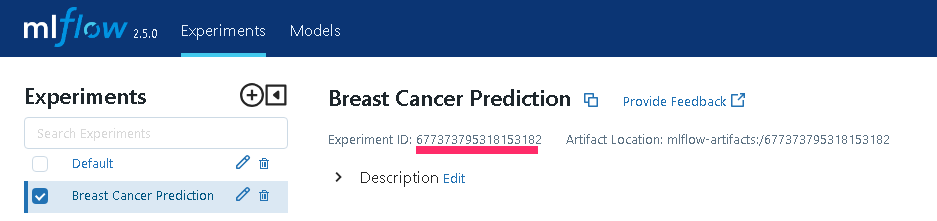
To form a new experiment, click on the “+” sign before the “Experiments”. Next, write the name for your experiment and then click on “Create”.

This creates a new experiment on the dashboard with an experiment ID.
An interesting thing about the MLflow dashboard is that you can use this together with your existing Python code to log your experiment and visualize the results. With only a few lines of code, you can record the parameters, results, and even the complete model in binary form.
Experiment Tracking of Basic ML Algorithm with MLfow
Let’s build a basic machine-learning model to classify the breast cancer into malignant and benign based on the characteristics of the tumor. For this example, we use the Jupyter Notebook to load and process the data, train the model, and predict the results.
Let’s begin with importing the necessary dependencies:
from sklearn.datasets import load_breast_cancer
from sklearn.model_selection import train_test_split
from sklearn.ensemble import RandomForestClassifier
from sklearn import metrics
from sklearn.metrics import accuracy_score, precision_score, recall_score
from sklearn.metrics import classification_report
Next, we load the breast cancer data from the sklearn package of Python and split it into “train” and “test” data. We use the target feature as “y” and the remaining features of the data as “x”:
df = load_breast_cancer()
#splitting the dataset
X_train, X_test, y_train, y_test = train_test_split(df.data, df.target)
Create a model evaluation function for simplicity:
accuracy = metrics.accuracy_score(y_pred=y_pred, y_true=y_test)
precision = metrics.precision_score(y_pred, y_test, average = 'weighted')
recall = metrics.recall_score(y_pred, y_test, average = 'weighted')
print(classification_report(y_test, y_pred))
return accuracy, precision, recall
Adding MLflow Auto Log Tracking to the Code
We then use the automatic log training method to record the model’s parameters, artifacts, evaluation metrics, and lineage information while training. For this purpose, mlflow.autolog() is used. This function is commonly used to log the popular ML algorithms. For example, the following code tracks and records the “scikit-learn” run:
with mlflow.start_run(experiment_id=677373795318153182):
mlflow.autolog()
# Create the model with 100 trees
RF_model = RandomForestClassifier(n_estimators=100,
bootstrap = True,
max_features = 'sqrt', random_state=42)
RF_model.fit(X_train, y_train)
#predicting test set results
y_pred = RF_model.predict(X_test)
(accuracy, precision,recall) = eval_metrics(y_pred,y_test)
mlflow.sklearn.log_model(RF_model, "model")

In the previous code, we set a URI to connect the Python code with the MLflow dashboard using MLflow.set_tracking_uri (“http://127.0.0.1:5000”). Note that the UI that is obtained earlier to run the dashboard is used. Next, we use a “with” block. This starts the run on the MLflow instance with mlfow.start_run(). We pass an argument of experiment_id to the run statement. This is the ID that we obtained when we created the new experiment in the web dashboard.
Note that this ID allows us to collaborate the runs with our experiment. We employ the MLflow.autolog() for the automatic log of the model. Then, we create a random forest classifier, train the model, and predict the output of the “test” dataset. Finally, the log_model() function at the end is used to save the entire model to MLflow.
In case you don’t prefer auto logging and you want to log particular metrics and parameters of your run, you can use the following functions:
- MLflow.log_param()
- MLflow.log_metric()
These two commands only send the specific results to MLflow. However, make sure to import them first before using them in your code.
MLflow Experiment Runs
After running the code, we can visualize the log output on the dashboard. To accomplish this, you must first click the “Refresh” icon on the experiment dashboard. Then, you will see the updated tracking result of your runs. The experiment is the collection of all the runs of your code. Since we completed a single run, the dashboard only shows one result:

The MLflow dashboard opens in the default table view. You can also select the other viewing options from the menu, such as a chart view that shows the comparison of each run.
In the table view, the table rows show the individual runs, while the column shows all the relevant logging details of the run. This includes the name of the run, the time when it was executed, the total duration of the run, the model used, the accuracy and loss metrics, and the hyperparameters.
By clicking on the name of the run, you can also visualize the related details separately:

You can check all the related metrics values or all the parameters and hyperparameters of your corresponding model by clicking on the metrics tab and parameters tab, respectively.

In addition, you can also view the history of each metric by selecting its name. For instance, the following graph shows the training roc area under the curve of the model throughout the time:

Conclusion
An open-source platform called MLflow controls the machine learning life cycle. It provides different APIs for experiment tracking and other functions. Experiment tracking records all the necessary information such as metrics, parameters, and the mode from the machine learning experiment. This article demonstrates how to create an MLflow experiment and log the runs using Python API.
Source: linuxhint.com