Contour Plot in Python
“Contour Plot” is a graphical technique that shows the variation of a variable over a two-dimensional region. There are contour lines connecting points with identical variable values. Contour plots are useful for visualizing the relationship between two variables, such as elevation and rainfall or temperature and pressure. To create a contour plot, the “Matplotlib” library is used in Python.
This Python tutorial provides an in-depth guide on “Contour Plot” in Python using numerous examples.
How to Create a Contour Plot in Python?
To create a contour plot in Python, the “Matplotlib” library is used. To do so, we need to import the “pyplot” module and use the “contour” or “contourf()” function. The “contour()” function draws contour lines, while the “contourf()” function draws filled contours. Both functions take a “2D” array of values (z) as arguments that represent the height or the depth of the surface.
Syntax
The syntax of the “contour()” function is shown below:
The syntax of “contourf()” function is as follows:
Let’s start creating a contour plot with the “contour()” function:
Example 1: Create a Contour Plot Using the “contour()” Function
The below example code is used to create a contour plot using the “contour()” function in Python:
import matplotlib.pyplot as plt
value1 = numpy.linspace(-5, 5, 100)
value2 = numpy.linspace(-5, 5, 100)
X, Y = numpy.meshgrid(value1, value2)
Z = numpy.exp(-(X**2 + Y**2))
plt.contour(X, Y, Z)
plt.show()
According to the above code, apply the below-given steps:
- The “linspace()” function creates an array of “100” evenly spaced numbers between “-5” and “5” and assigns it to the variable “value1”.
- The “meshgrid()” function creates two “2D” arrays “X” and “Y” from the “1D” arrays “value1” and “value2”.
- After that, the “exp(-(X**2 + Y**2))” function creates another “2D” array named “Z” by applying this function to each element in “X” and “Y”. This is the function that we want to plot as a contour map.
- Now, apply the “contour()” function from the “pyplot” module having X, Y, and Z as arguments. This function draws contour lines on a plot, where each contour line represents a constant value of “Z” over the grid of “X” and “Y” values.
- By default, the contour function chooses the number and positions of the contour levels automatically based on the range of Z values.
- At last, the “show()” function displays the plot on the screen.
Output
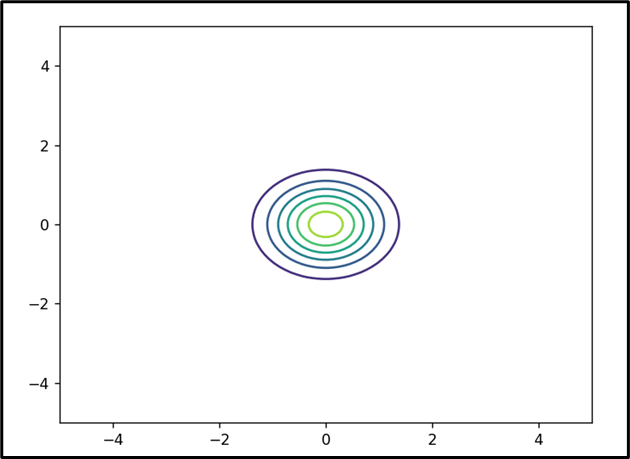
As shown in the snippet above, the contour plot has been displayed successfully.
Example 2: Create a Contour Plot Using the “contourf()” Function
The following block code is utilized to create a contour plot via the “contourf()” function:
import matplotlib.pyplot as plt
X, Y = numpy.meshgrid(numpy.linspace(-5.0, 5.0, 50), numpy.linspace(-5.0, 5.0, 50))
fig,ax=plt.subplots(1,1)
cp = ax.contourf(X, Y, numpy.sqrt(X**2 + Y**2))
fig.colorbar(cp)
ax.set_title('Contours Plot')
ax.set_ylabel('y (cm)')
plt.show()
In the above example code:
- The “numpy” library and “pyplot” modules are imported.
- The “meshgrid()” function is used to create a 2D grid of “X” and “Y” values with “50” points in each dimension ranging from “-5” to “5”.
- The “subplots()” is used to create a figure and an axes object.
- The associated “contourf()” function plots the filled contours of the function “f(x,y)” on the axes.
- The “colorbar()” function adds a colorbar to the figure.
- The “set_title()” and “ax.set_ylabel()” functions are used to set the title and the “y-axis” label of the axes, respectively.
- Finally, the figure is displayed using the “show()” function.
Output
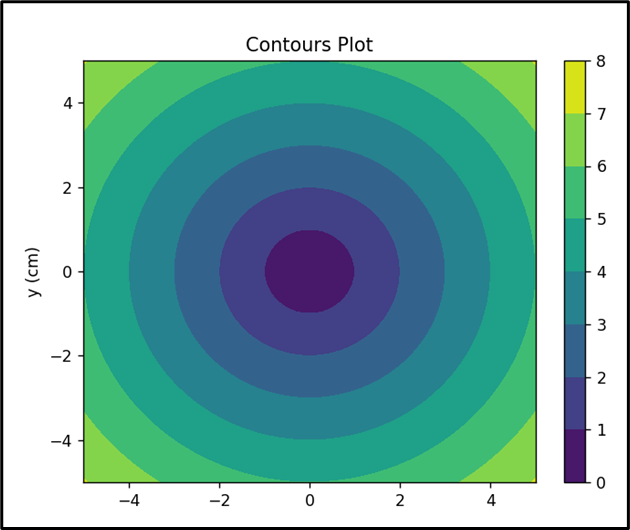
As analyzed, the contour plot has been plotted successfully.
Conclusion
The “contour()”, or the “contourf()” functions of the “Matplotlib” library are used in Python to create and customize “Contour Plots”. Different parameters and options can be used to adjust the appearance and behavior of the contour lines or regions. This blog delivered an in-depth overview of “Contour Plots” in Python using appropriate examples.
Source: linuxhint.com