Breakpoints in JavaScript
This blog will demonstrate the breakpoints in JavaScript and its usage.
What are Breakpoints in JavaScript?
Breakpoints are the most fundamental debugging tools in the developer’s toolbox. It is used to indicate the position where errors occur. This allows the program to execute properly till it reaches the significant code block where an error might occur.
Let’s see how the breakpoint works.
How to Use breakpoints?
Follow the given steps to use breakpoints and identify the line of code on which the error occurred.
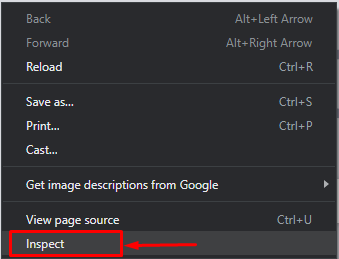
Step 1: Open the Debugger
All the current browsers provide a JavaScript debugger. The debugger window allows setting breakpoints in JavaScript code. First, open the debugger window called “DevTools”. Right-click on the browser and select the “Inspect” option or by using the shortcut key “Ctrl+Shift+I” or you can simply press the “F12” key:
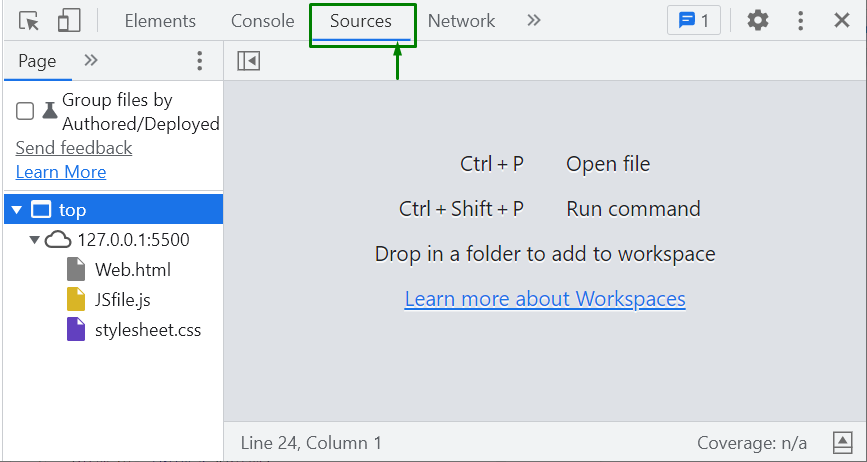
Step 2: Open Source Panel
Click on the “Sources” panel, which helps us debug JavaScript. It has three main sections, “the file navigator” on the left side of the window, “the code editor section” on the right side of the window, and the “debugger section” on the bottom right of the window:
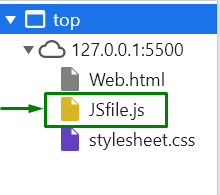
Step 3: Open the JavaScript File
From the “the file navigator” section, click on the “js” file, and it will open at the “the code editor section” on the right side of the window:
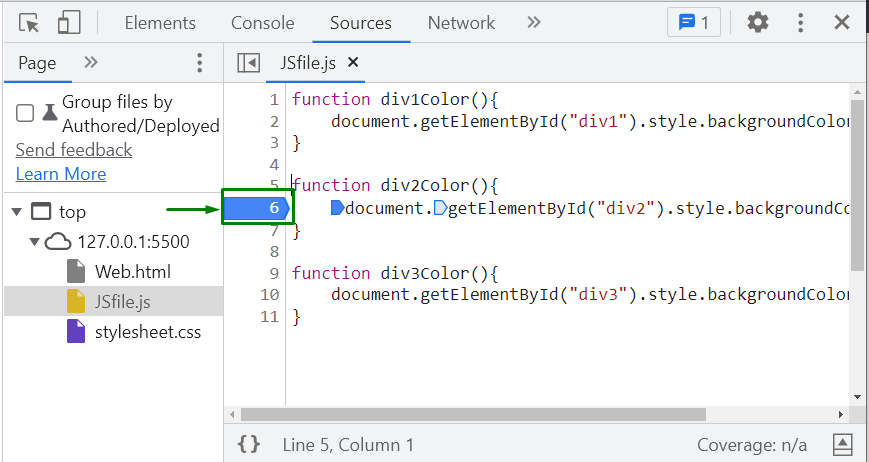
Step 4: Set the breakpoints
Set a breakpoint on a line in “the code editor section” by clicking the line number column:
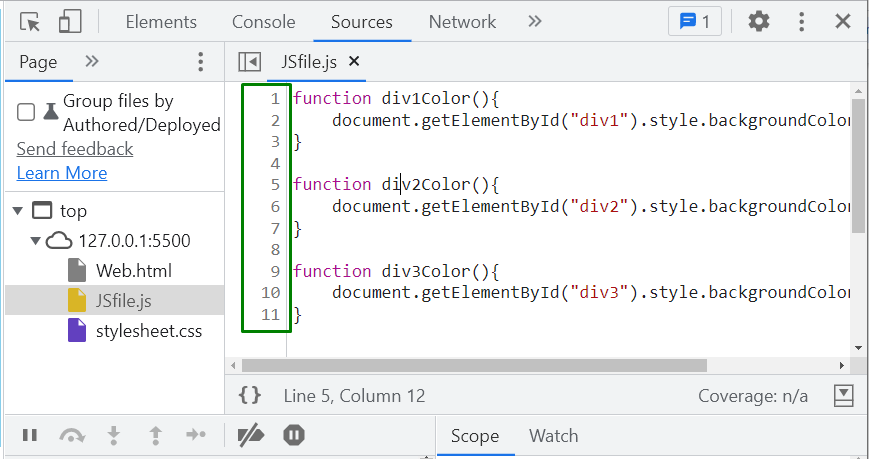
We have placed a breakpoint on line 6. Here, the code will stop running. Additionally, you can set multiple line-of-code breakpoints:
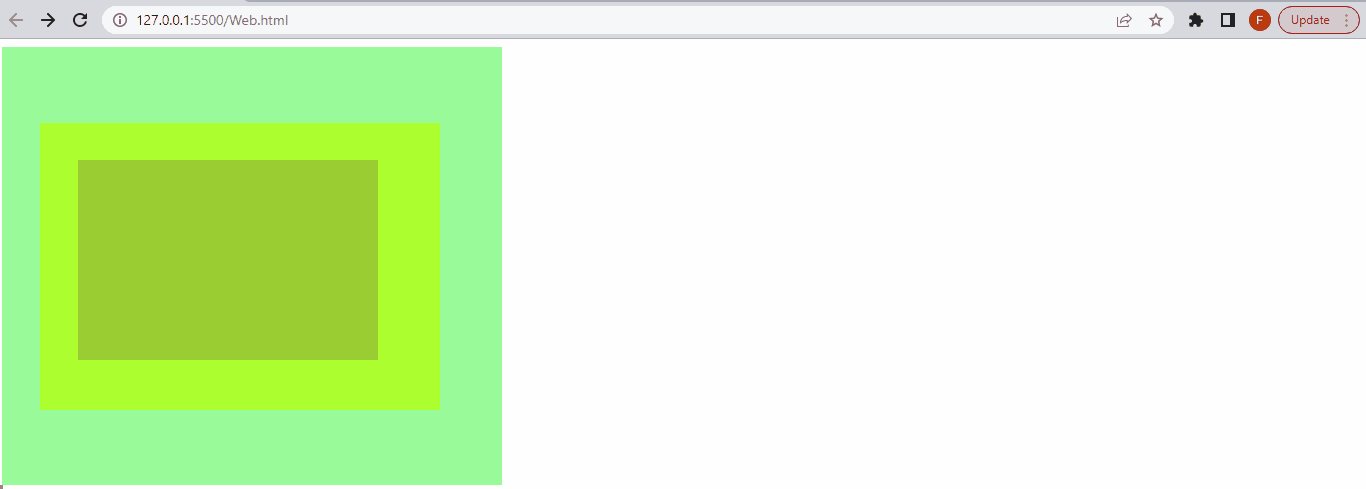
In the given example, we will just set the breakpoints and run the code to see how it works. After setting the breakpoint, the code execution will stop so that we can inspect the values.
Output
We have covered the basic instructions related to breakpoints in JavaScript.
Conclusion
Breakpoints are one of the most fundamental debugging tools in the developer’s toolbox. It is used to find the position of the logical error. Simply place a breakpoint whenever you want the debugger to stop the current execution. Open the Source panel in DevTools and set the breakpoint on the code editor section by clicking the line number column. In this blog, we demonstrated the breakpoints in JavaScript and how to set breakpoints to debug the code.
Source: linuxhint.com