Seaborn Histplot
A “Histogram” is a type of plot that shows the frequency or count of values that fall into discrete bins or intervals. It is useful for summarizing the shape and spread of a variable, as well as identifying outliers, gaps, or modes. The “seaborn.histplot()” function of the “seaborn” library is used to create histograms for both univariate and bivariate data.
This write-up will explain a complete guide on Python “seaborn.histplot()” method using the below content:
- What is the “seaborn.histplot()” Method in Python?
- Plotting Histogram Using the “seaborn.histplot()” Method.
- Plotting Histogram by Adding a “(KDE)” Using the “seaborn.histplot()” Method.
- Changing the Type of Graph to be Plotted Using the “seaborn.histplot()” Method.
- Plotting Histogram With Controlling “bins” Numbers Using the “seaborn.histplot()” Method.
What is the “seaborn.histplot()” Method in Python?
In Python, the “seaborn.histplot()” method is utilized to visualize the distribution of one or more variables in a dataset. It can be utilized to create either univariate or bivariate histograms. As a classic visualization tool, a histogram displays a variable’s distribution by counting the num/number of values falling within discrete “bins”.
Syntax
Parameters
In the above syntax:
- The “data” parameter specifies the given/input data as a NumPy array or dataframe.
- The “x” and “y” parameters determine the data key on the “x” and “y” axes.
- The “hue” parameter determines the color of plot elements by mapping a semantic data key.
- The “stat” parameter indicates the count, density, frequency, or probability.
Note: The other optional parameters are used to perform specific operations in Python. Check this documentation for a detailed understanding of the seaborn “histplot()” method syntax and its parameters.
Return Value
The “seaborn.histplot()” method retrieves matplotlib axes with the plot drawn on them.
Example 1: Plotting Histogram Using the “seaborn.histplot()” Method
In the following code, the “seaborn.histplot()” method plots the histogram:
import matplotlib.pyplot as plt
data=seaborn.load_dataset("tips")
seaborn.histplot(data=data, x="total_bill", hue="time")
plt.show()
In the above code:
- The “seaborn” and “matplotlib” modules are imported.
- The “seaborn.load_dataset()” method is used to load the seaborn predefined data set named “tips”.
- The “seaborn.histplot()” method takes the dataset, along with the “x” parameter and “hue” parameter values, to plot the histogram.
Output
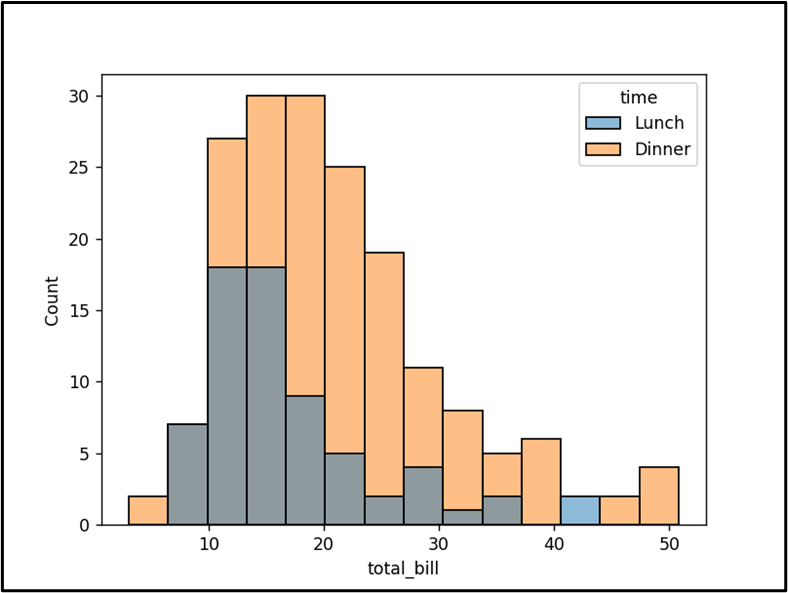
This snippet concludes that the histogram has been plotted successfully.
Example 2: Plotting Histogram by Adding a (KDE) Using the “seaborn.histplot()” Method
The below code plots the histogram by adding the kernel density estimate “(KDE)” using the “seaborn.histplot()” method:
import matplotlib.pyplot as plt
data=seaborn.load_dataset("tips")
seaborn.histplot(data=data, x="total_bill", hue="time", kde=True)
plt.show()
In the above code lines, the “seaborn.histplot()” method takes the “dataset”, “x”, and “hue” parameters along with the “kde” parameter, respectively, to add the kernel density estimate on the top of the histogram.
Output
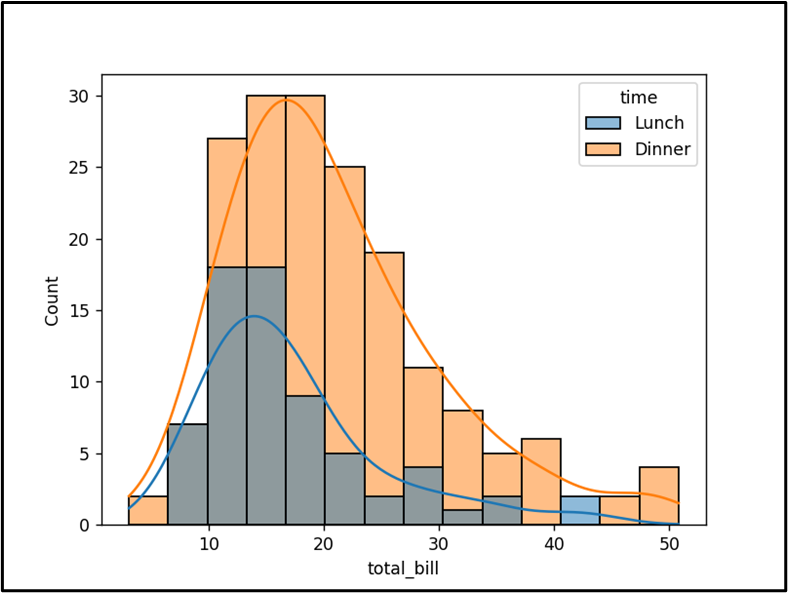
The “KDE” on the top of the histogram has been created appropriately.
Example 3: Changing the Type of Graph to be Plotted Using the “seaborn.histplot()” Method
The “element” parameter is used to change the type of the graph, such as bar, poly, and step to be plotted.
import matplotlib.pyplot as plt
data=seaborn.load_dataset("tips")
seaborn.histplot(data=data, x="total_bill", hue="time", kde=True,element="poly")
plt.show()
In this code, the “seaborn.histplot()” method takes all the necessary parameters along with the “element” parameter that specifies the type of graph that needs to be plotted.
Output
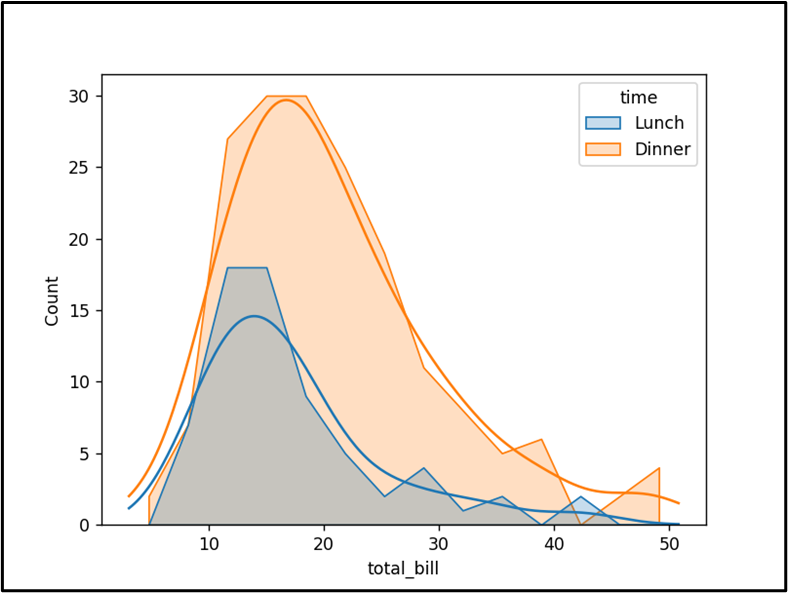
The histogram with the “poly” type graph has been displayed successfully.
Example 4: Plotting Histogram With Controlling “bins” Numbers Using the “seaborn.histplot()” Method
The histogram can also be plotted with a controlled number of “bins” using the discussed method with the “bins” parameter:
import matplotlib.pyplot as plt
data=seaborn.load_dataset("tips")
seaborn.histplot(data=data, x="total_bill", hue="time", bins=50)
plt.show()
In the above code, the “seaborn.histplot()” method takes the “data”, “x”, “y”, “hue”, and “bins” parameters as its arguments, respectively, to plot the histogram based on the value of the bin. The “bins” here divide the range values into intervals.
Output
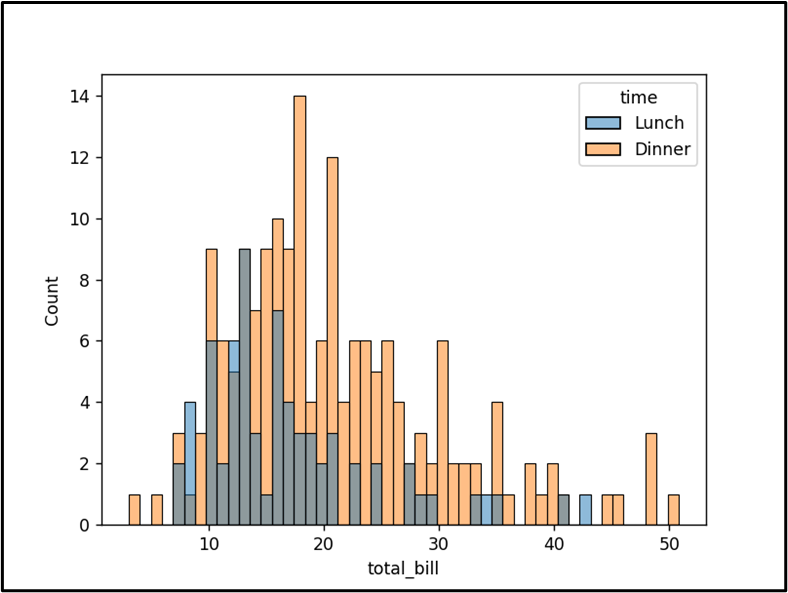
The histogram based on the value of the bin has been plotted successfully.
Conclusion
The “seaborn.histplot()” method is used to plot the univariate or bivariate histogram based on the specified “bins” value. This method takes several parameters such as “bins”, “KDE” and “element”, etc. to modify the bins value interval, the kernel density estimation, and the type of the graph to plot the histogram. This Python write-up presented a detailed guide on the “seaborn.histplot()” method using the examples.
Source: linuxhint.com